
SMART IRRIGATION
MANAGE YOUR CROPS
ANALYZE DATA
OPTIMIZE WATER USE
A smart platform designed to address modern challenges in agriculture, optimizing water use, improving productivity and promoting sustainability.
A data-driven approach to reduce waste, optimize water balance, and monitor crop conditions in real time.
Integrate weather, soil, crop, and satellite data to tell you when to irrigate and how much water to use.
CREATE YOUR OWN FIELD
AND ANALYZE YOUR CROP DATA
Draw your field boundaries directly on the map based on your available hectares.
Apply a predefined soil composition or customize it by adjusting the percentages of sand, silt, clay, humus, and limestone.
The following infomations are displayed for each soil:
- VEGETATION INDICES
- SOIL MOISTURE AND TEMPERATURE
- HISTORICAL METEOROLOGICAL DATA
- WEATHER FORECAST

- Click on the bold headings
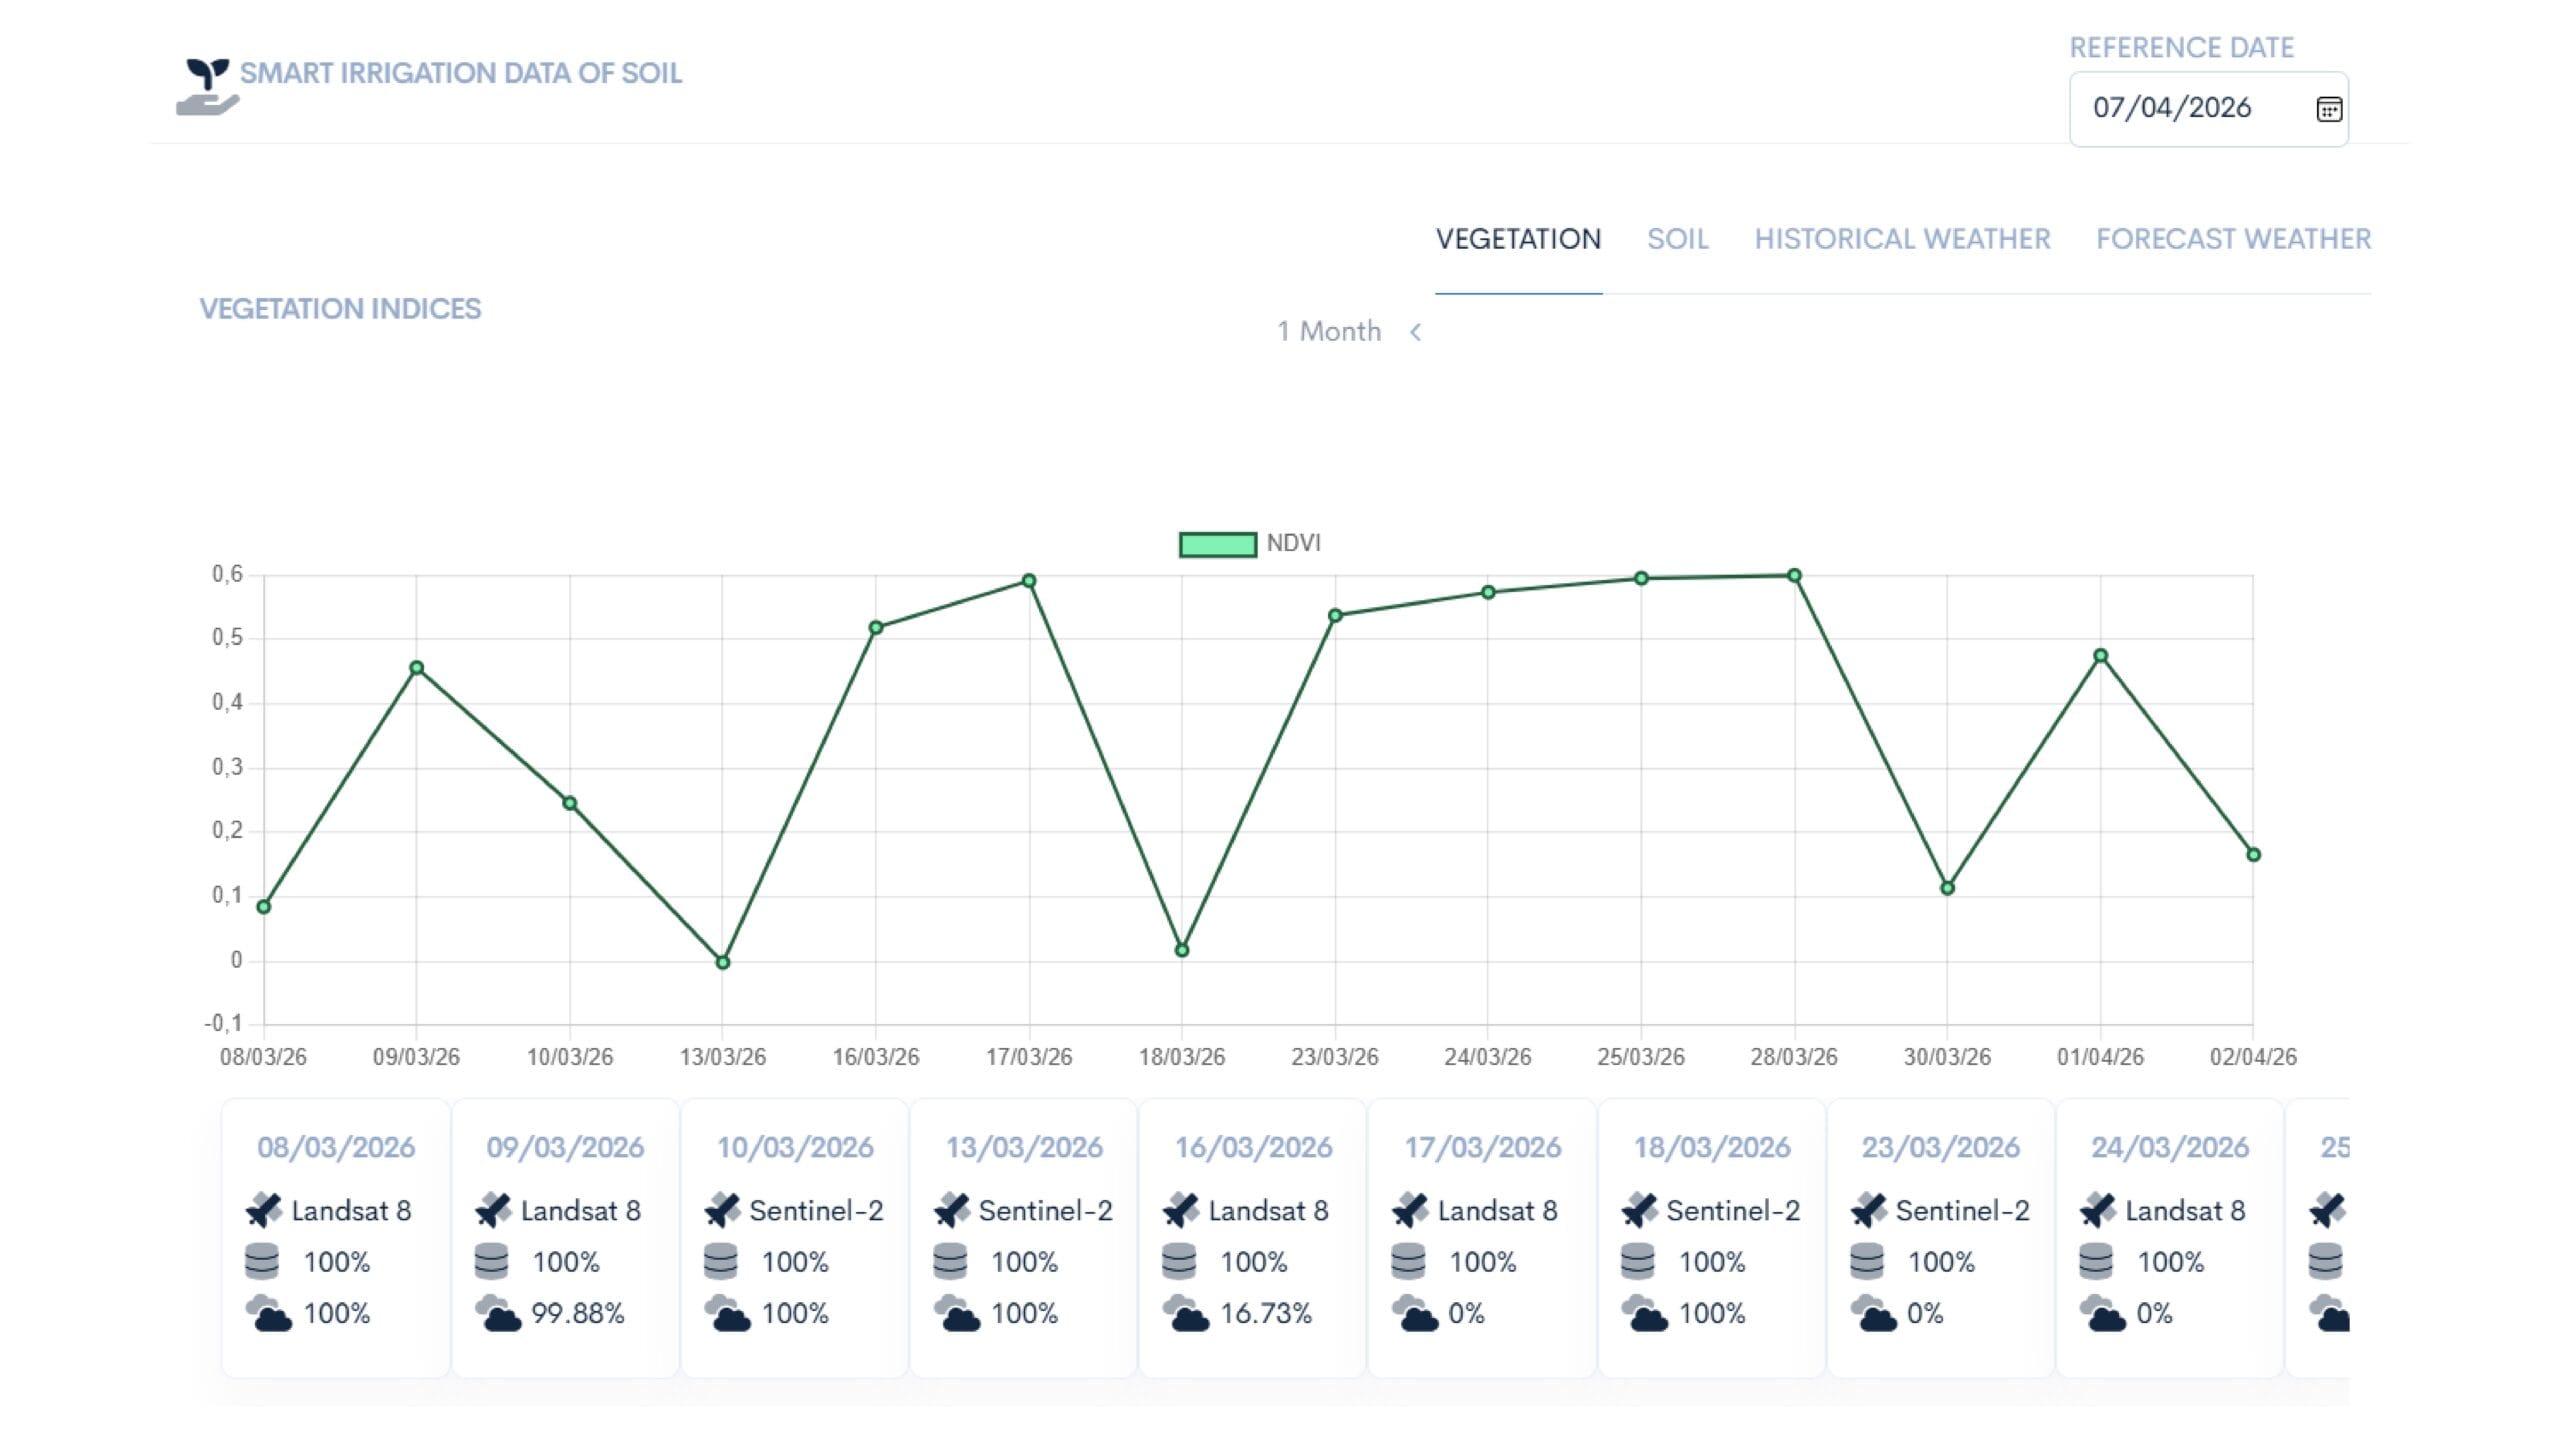
- TRACK CROP VEGETATION TRENDS
- MONITOR CROP HEALTH OVER TIME (1–6 MONTHS)
- IMPROVE WATER USE EFFICIENCY
- MAINTAIN OPTIMAL WATER BALANCE FOR YOUR CROPS
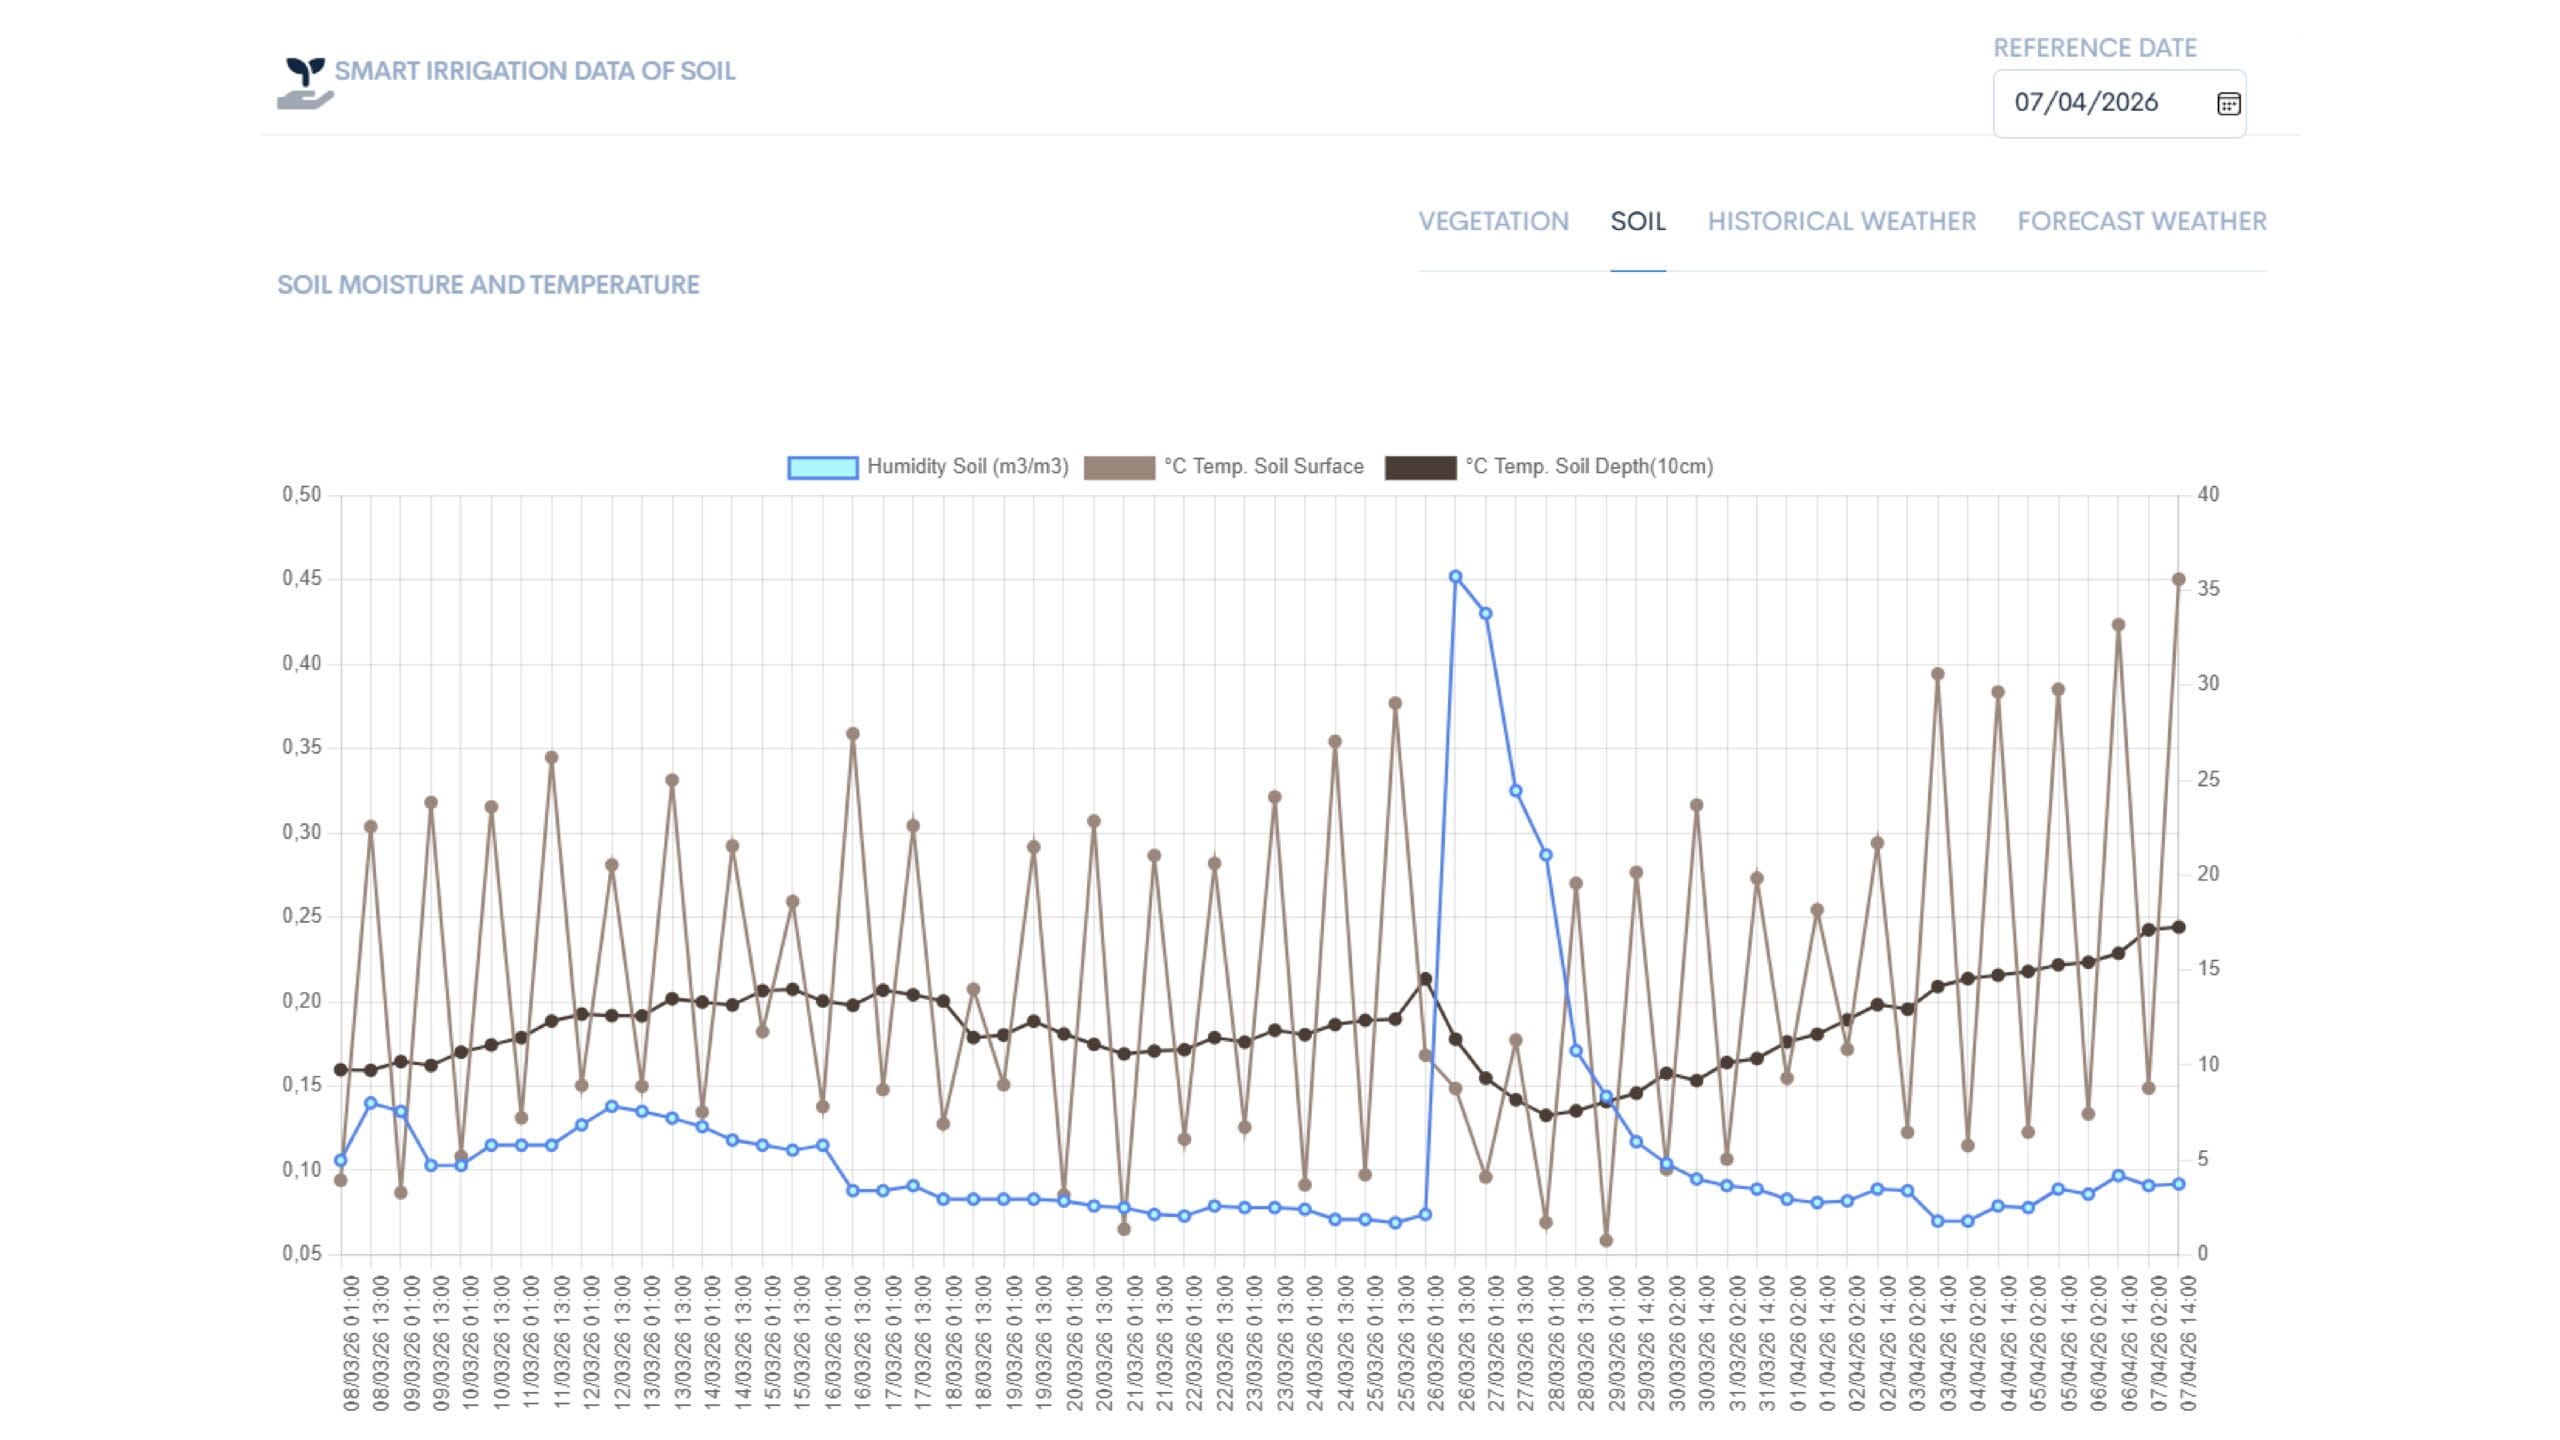
- DAILY MEASUREMENTS, EVEN AT 10 CM DEPTH
- UNDERSTAND YOUR CROPS’ ACTUAL WATER NEEDS
- PREVENT WATER DEFICITS AND OVER-IRRIGATION
- ENABLE HIGHLY TARGETED IRRIGATION SCHEDULING
- IMPROVE SOIL EFFICIENCY
- ENHANCE SOIL PRODUCTIVITY
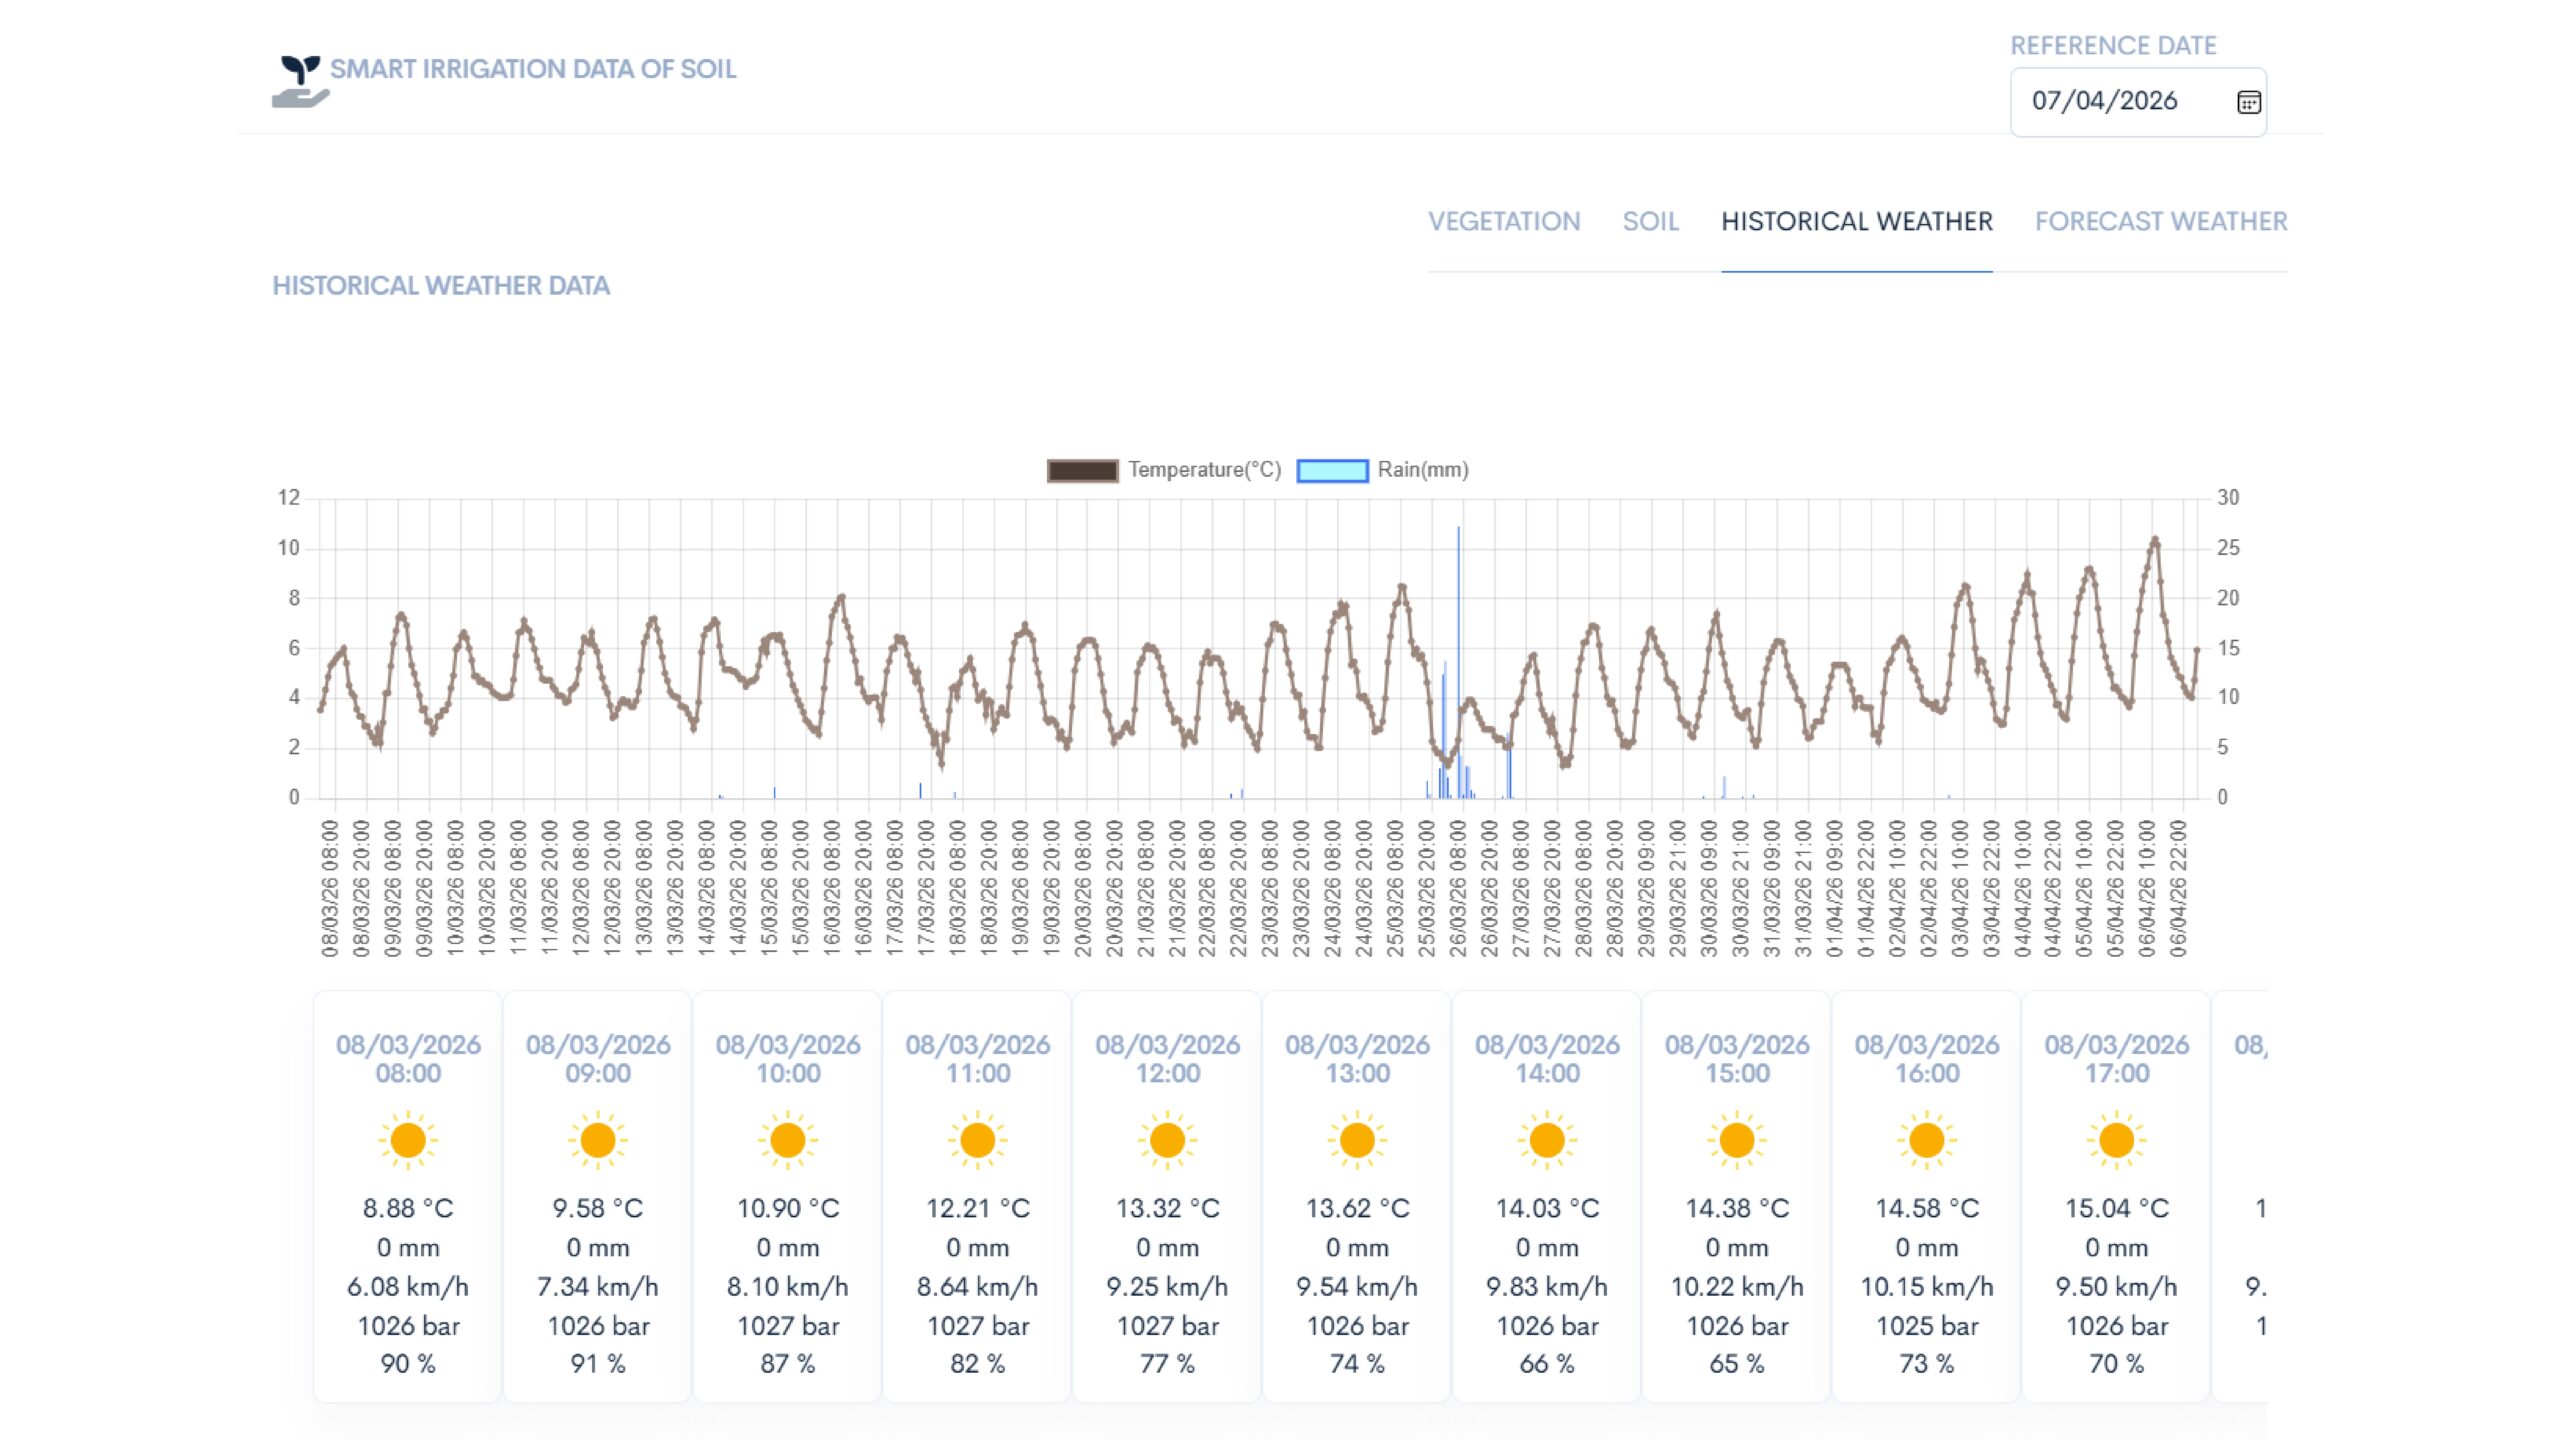
- GAIN MORE ACCURATE INSIGHTS INTO PAST WEATHER TRENDS
- MAKE BETTER AGRICULTURAL DECISIONS
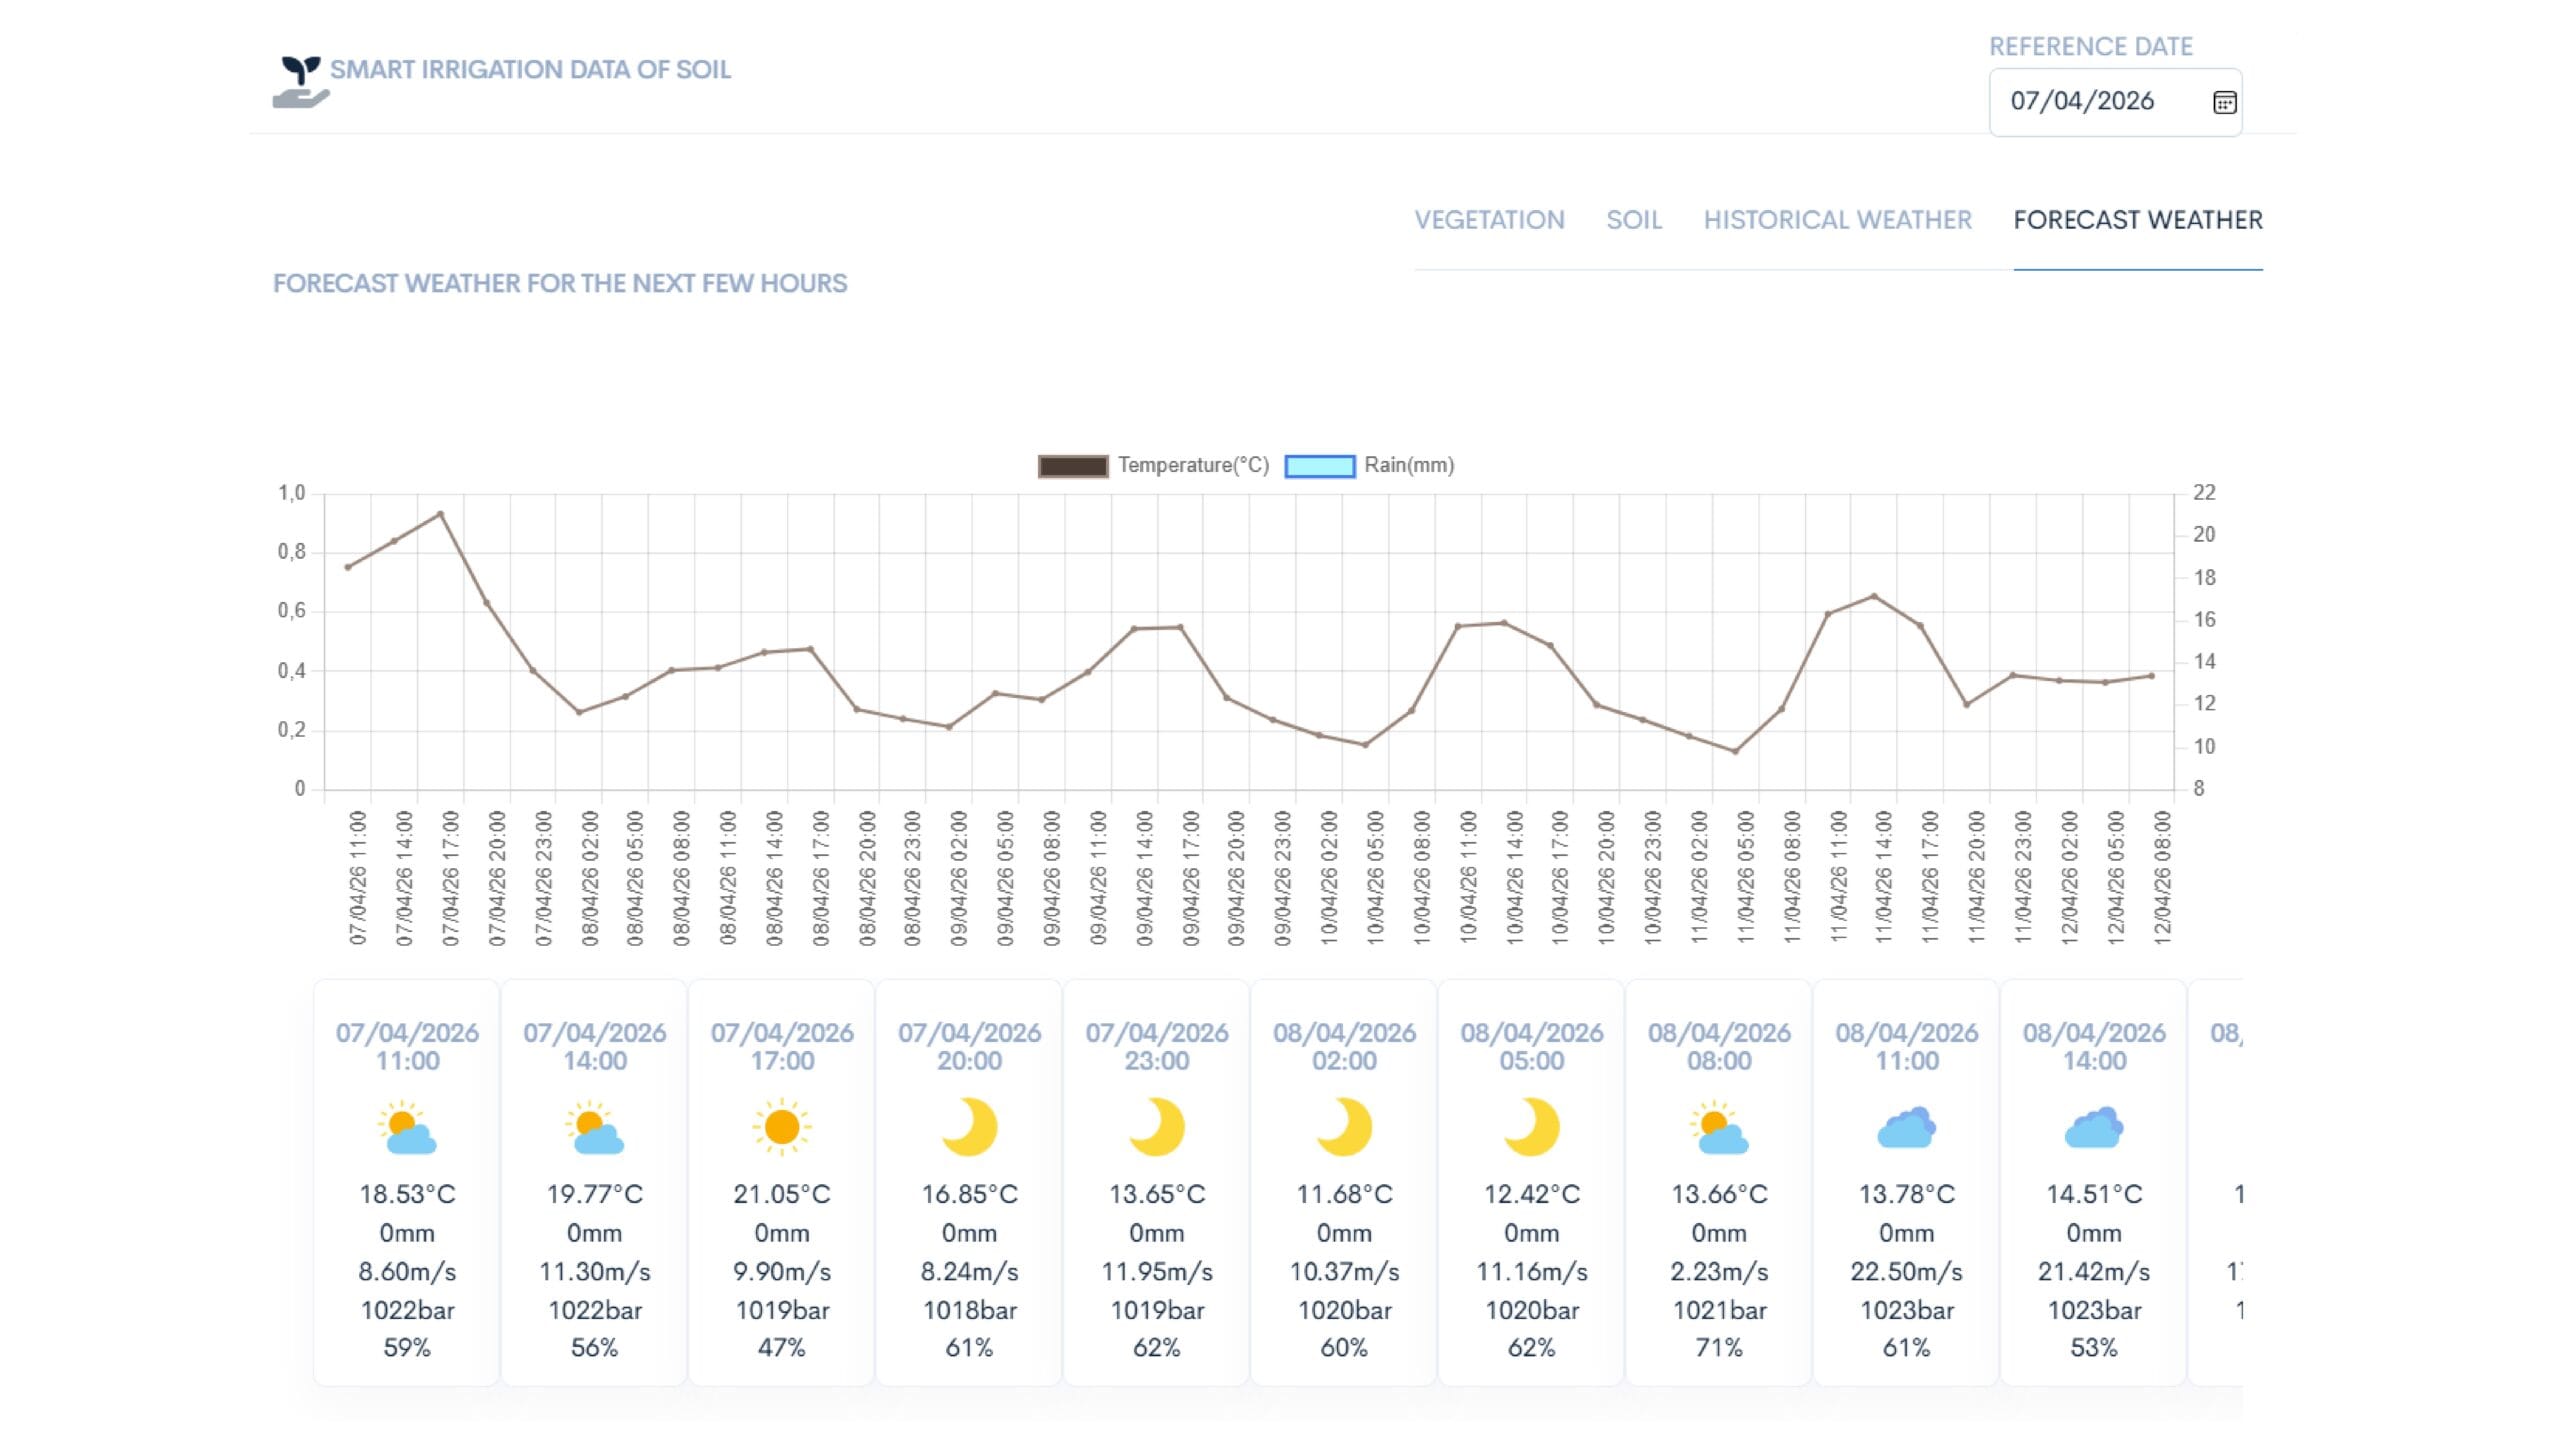
Detailed 3-hour weather forecast for the next 5 days
- TEMPERATURE
- RAINFALL
- HUMIDITY
- CLOUD COVER
- ATMOSPHERIC PRESSURE
IRRIGATION ADVICE
UPDATED EVERY 12 HOURS
The preview includes:
- WATERING RECOMMENDATIONS (how much to irrigate)
- SOIL AND SATELLITE ANALYSIS
- SOIL MOISTURE
- SATELLITE-BASED STRESS INDICATORS
- WATER DEFICIT
Selecting a recommendation provides access to detailed insights, including water balance, summaries, and historical trends.
WATER
TODAY
- HOW MUCH TO IRRIGATE
- IRRIGATION DURATION
- WATER DEFICIT
INCONSISTENT
RECOMMENDATIONS
- SOIL-BASED RECOMMENDATION
- SATELLITE-BASED RECOMMENDATION
- FIELD VERIFICATION REQUIRED
NO IRRIGATION
NEEDED
- RAIN IS EXPECTED IN THE NEXT FEW HOURS
- CURRENT SOIL MOISTURE LEVELS ARE SUFFICIENT
SOIL IRRIGATION PARAMETERS
Calculation of the total volume of water required to make up the deficit, analysis of soil moisture levels, calculation of irrigation duration based on the system’s flow rate, details of the last irrigation.
Display of the crop, the phenological stage, the current Kc coefficient, the soil type and the estimated moisture content.
LOCAL WEATHER DATA AND
SATELLITE VEGETATION INDICES
Display of the following daily data: average temperature, relative humidity, cumulative rainfall, 3-day rainfall forecast, wind, solar radiation and evapotranspiration.
It analyses NDVI (vegetative vigour), NDWI (vegetation water content), EVI (green biomass) and DSWI (crop water stress).
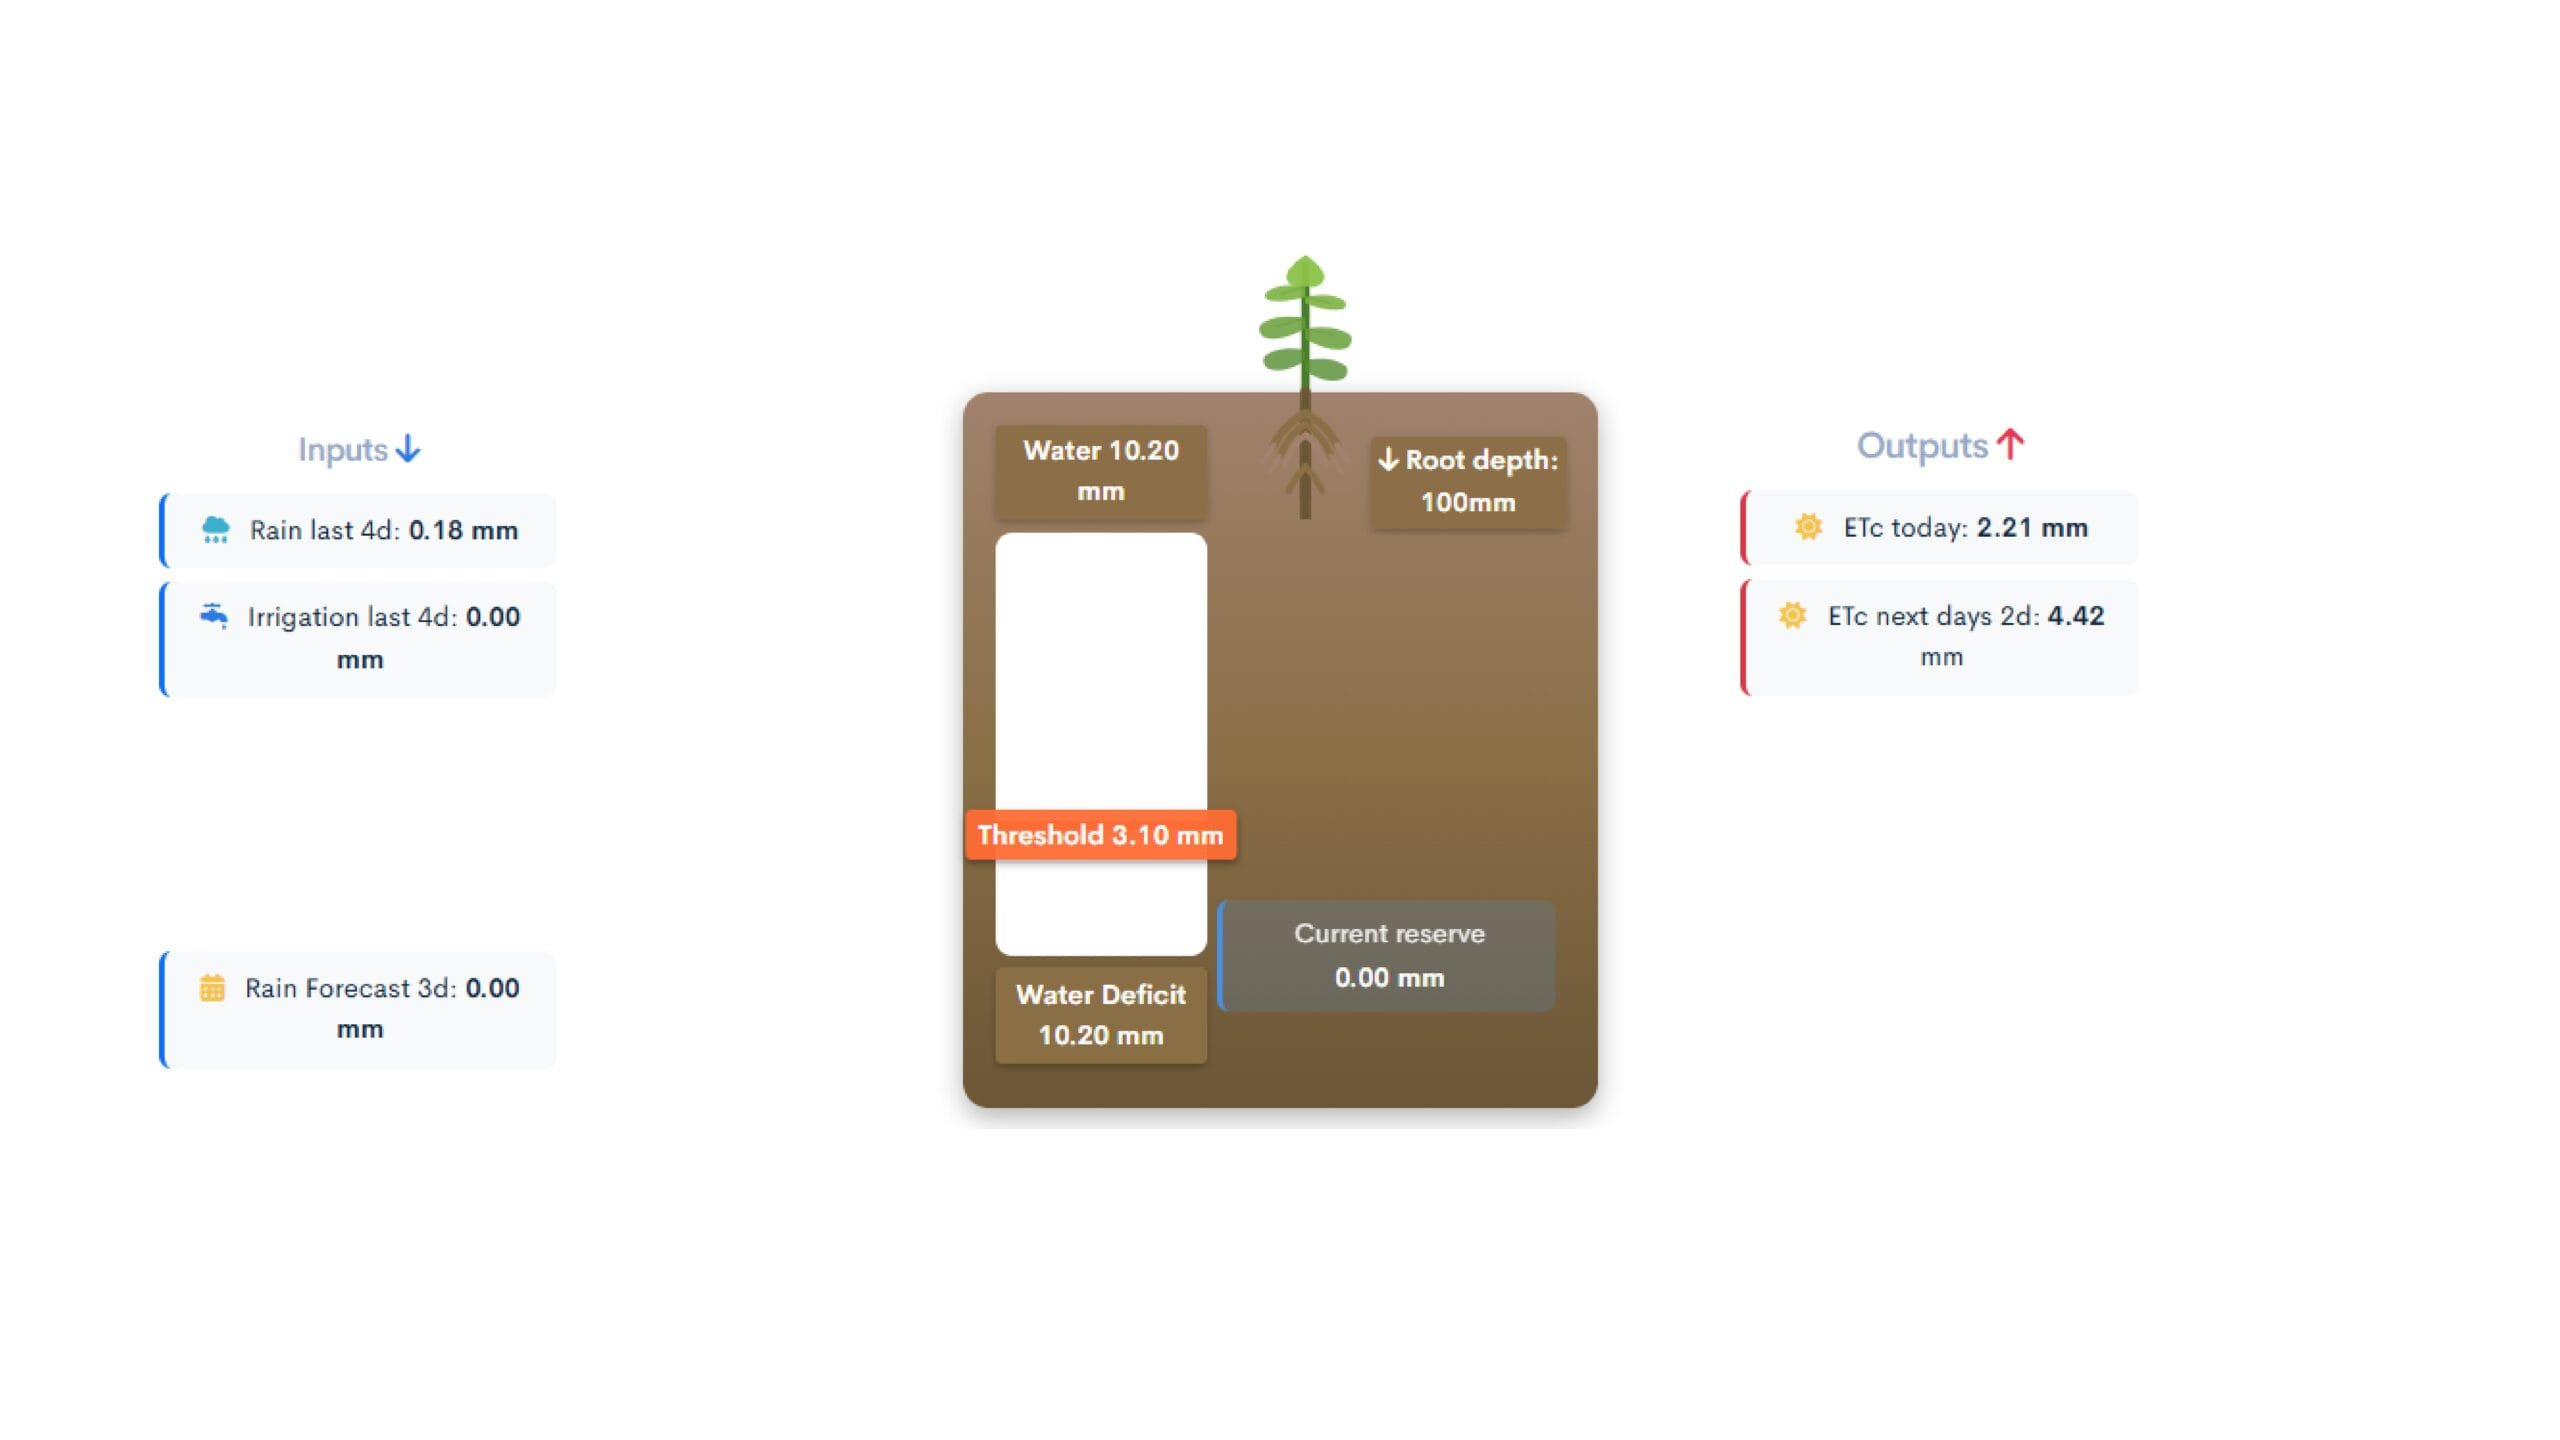
WATER BALANCE
- MAXIMUM WATER CAPACITY
- OPTIMAL MOISTURE RANGE
- AVAILABLE WATER
- CURRENT WATER DEFICIT
- SOIL WATER BALANCE (INFLOW VS OUTFLOW)
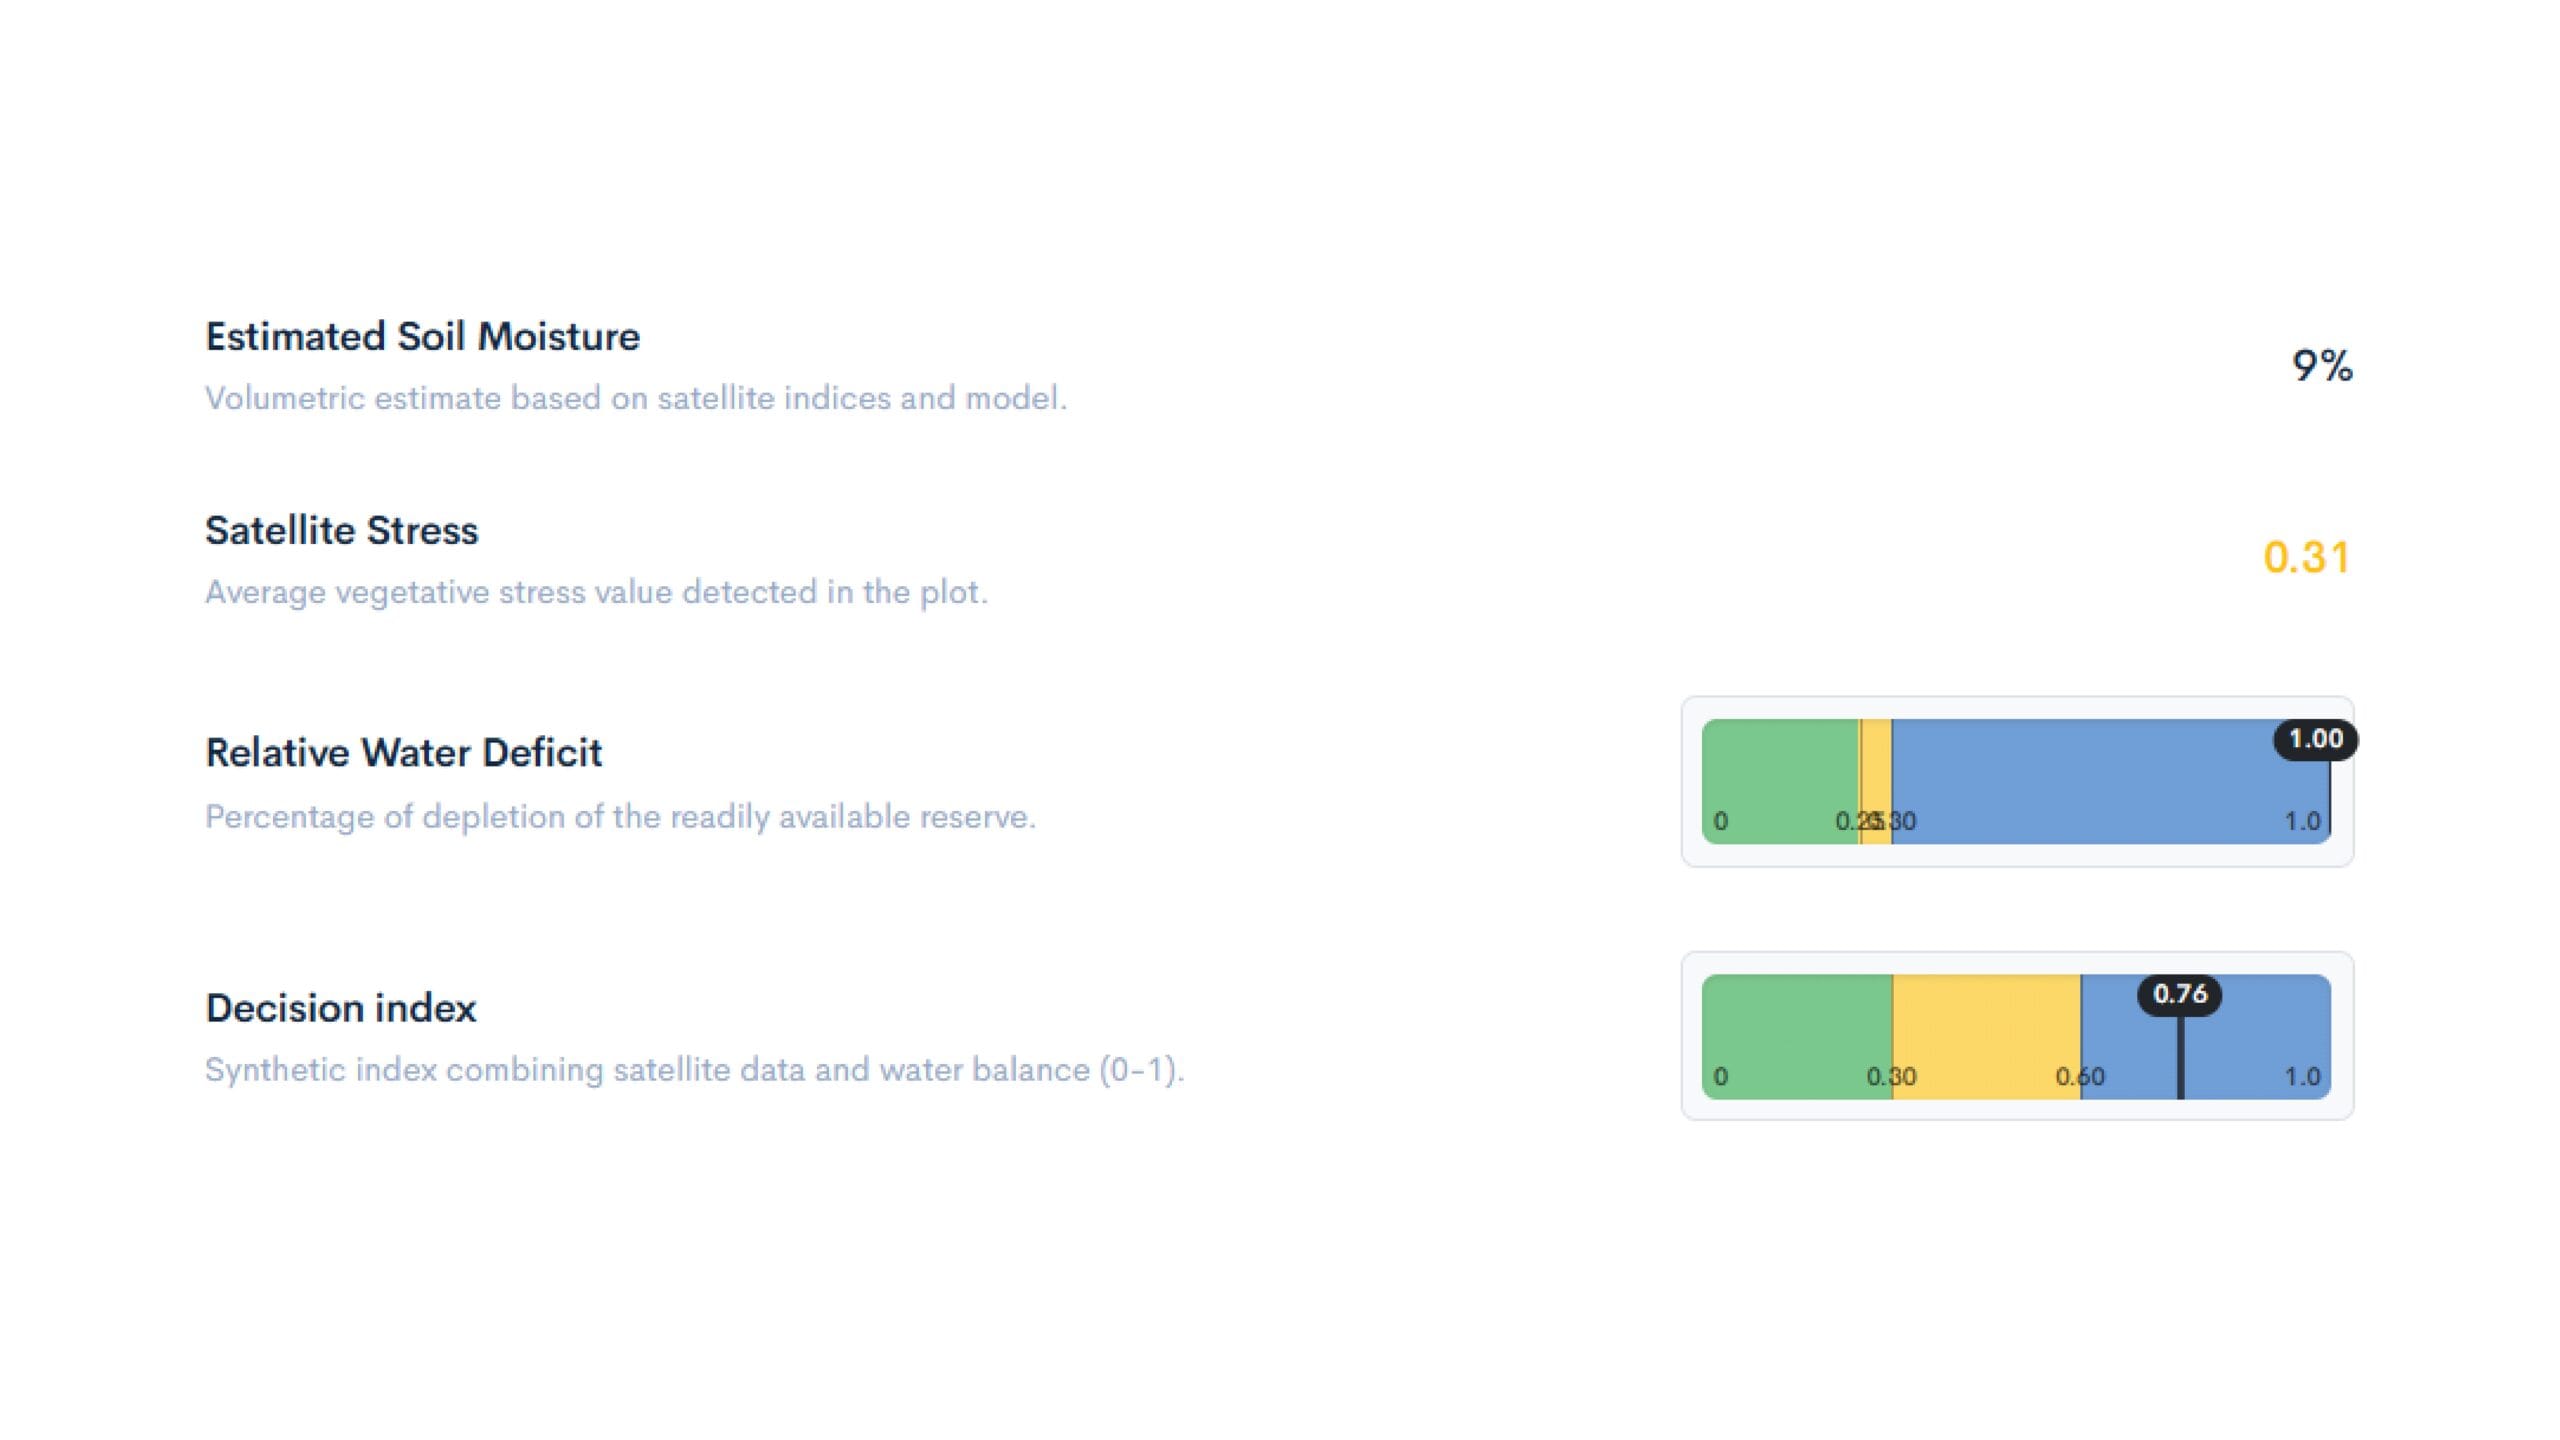
SATELLITE ACCOUNTS
- ESTIMATED SOIL MOISTURE
- SATELLITE VEGETATION STRESS DETECTED
- RELATIVE WATER DEFICIT
- DECISION-MAKING INDICATOR
SATELLITE ACCOUNTS
- ESTIMATED SOIL MOISTURE
- SATELLITE VEGETATION STRESS DETECTED
- RELATIVE WATER DEFICIT
- DECISION-MAKING INDICATOR
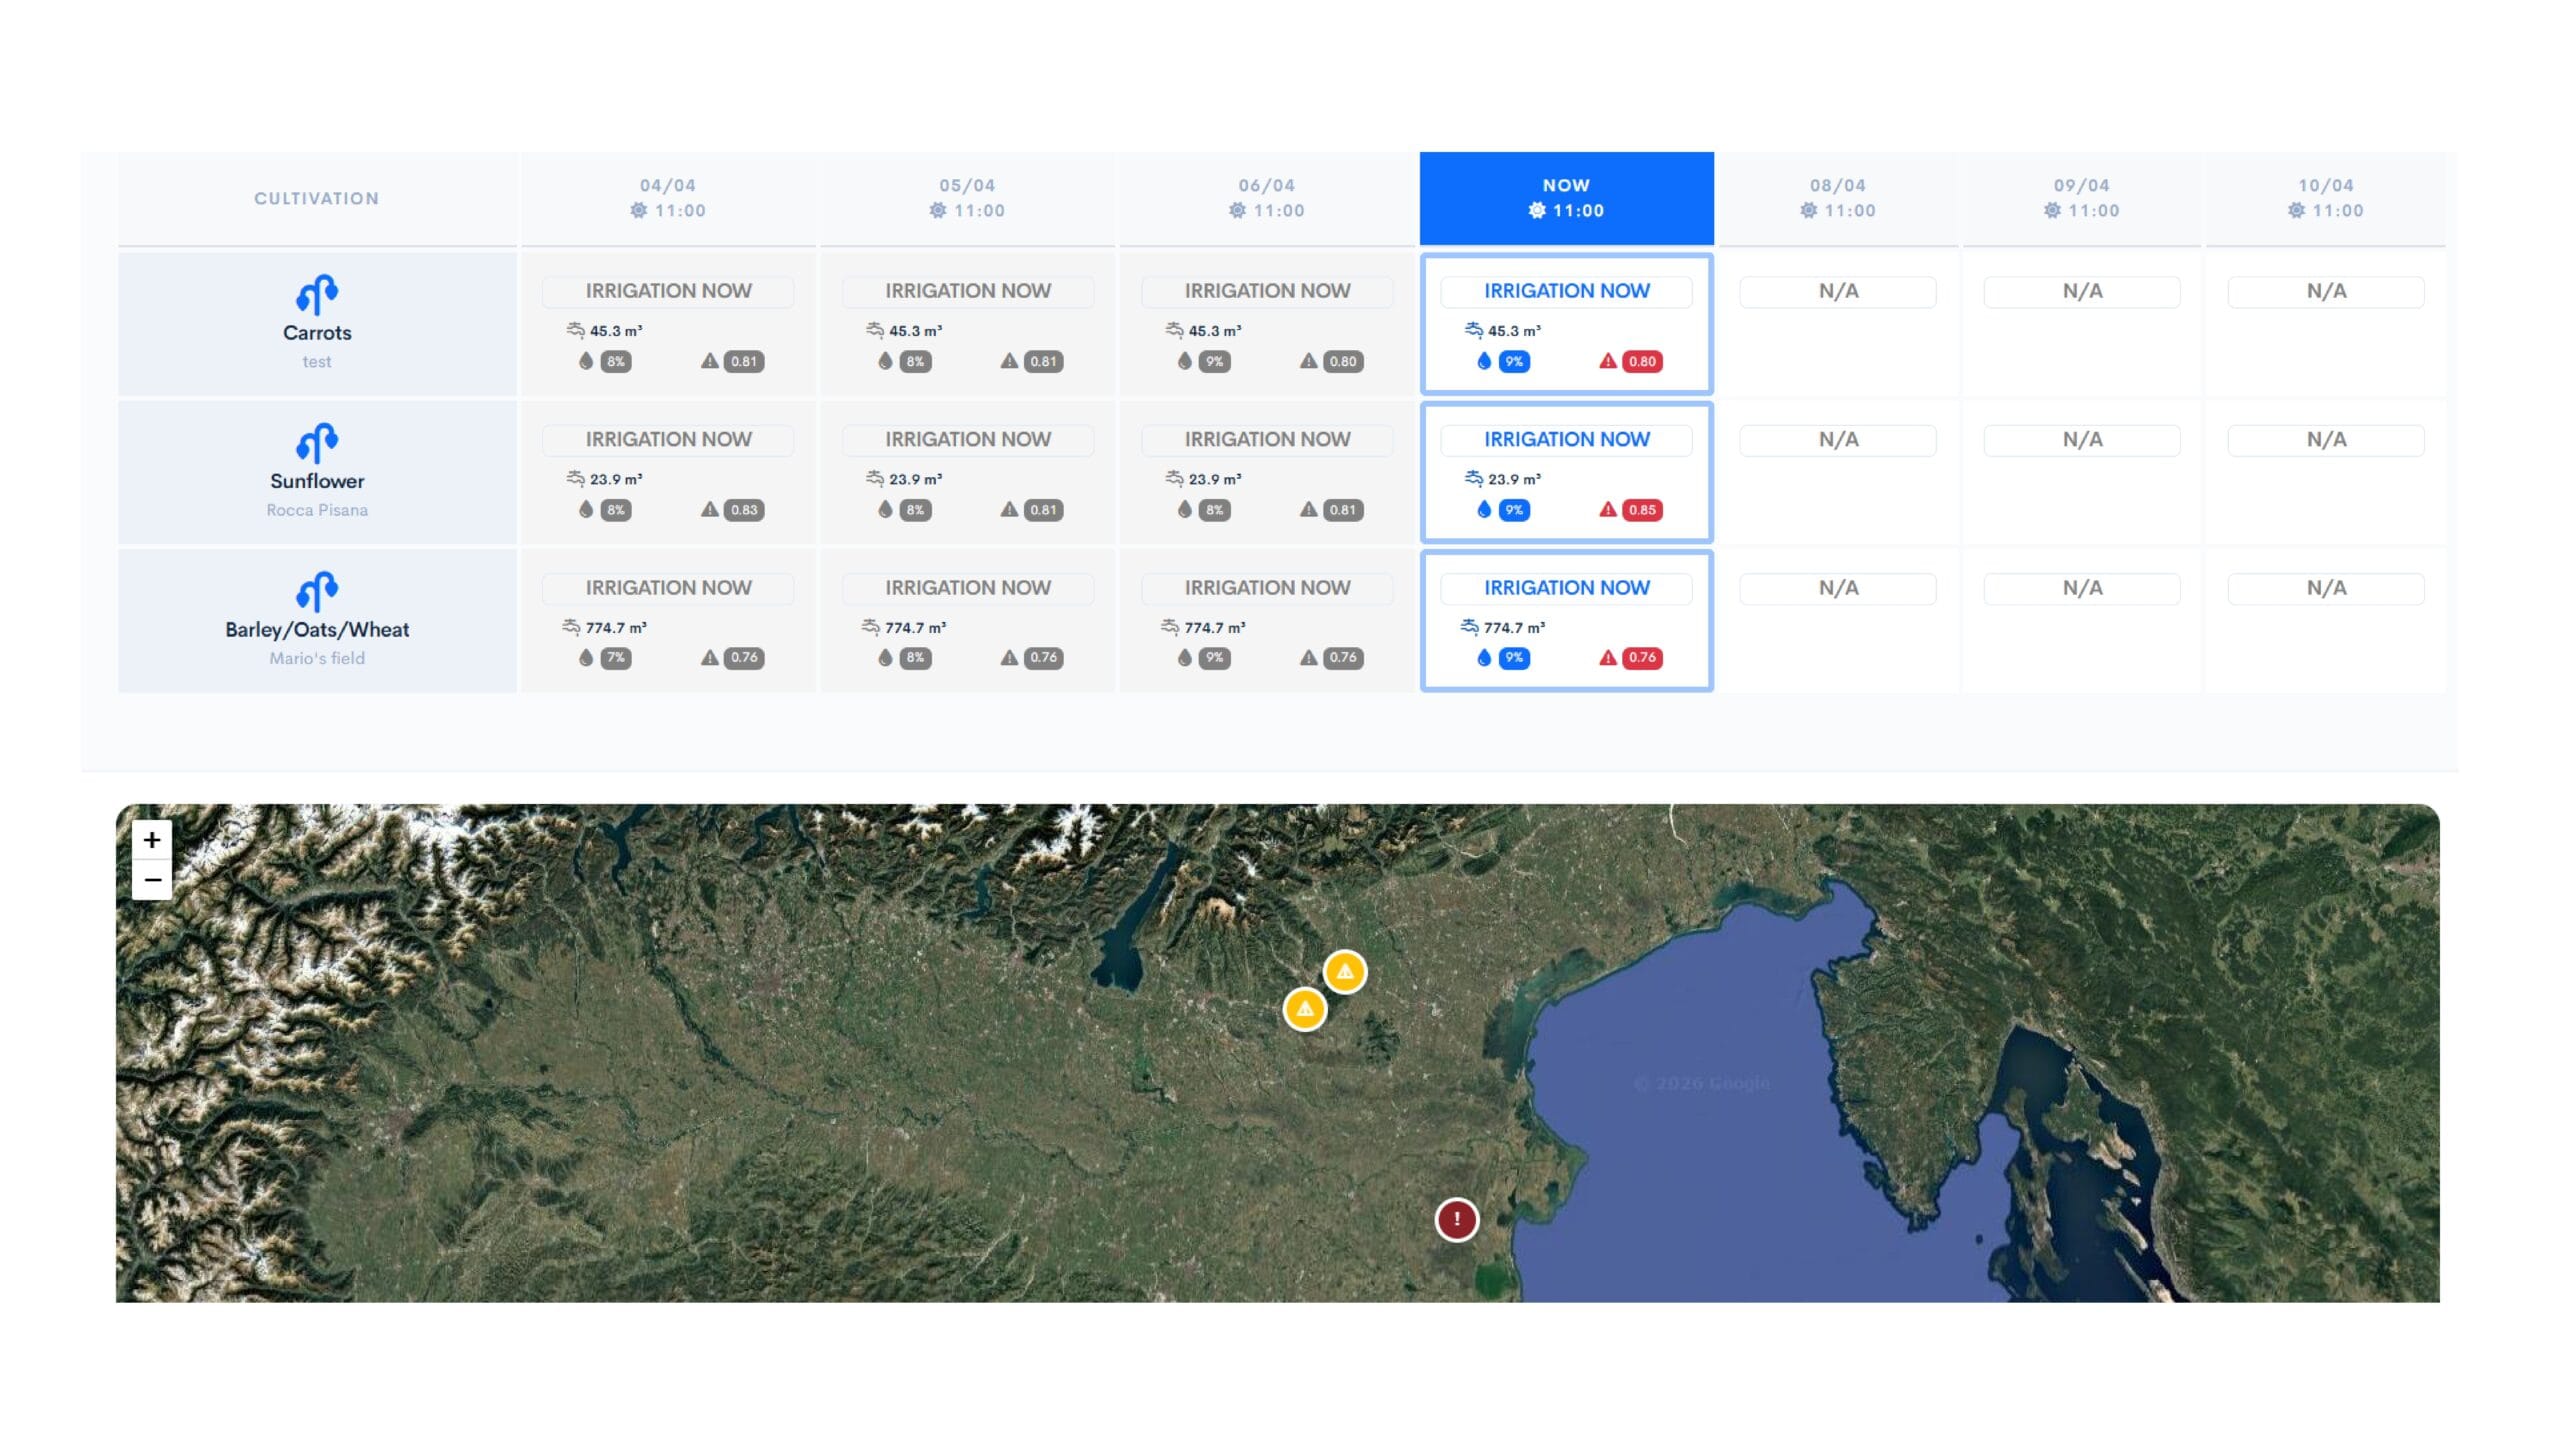
CROPS
- CULTIVATION
- WEATHER DATA
IRRIGATION RECOMMENDATIONS - FIELD MAP

WATER BALANCE
- MAXIMUM RESERVE
- COMFORT THRESHOLD
- AVAILABLE WATER
- CURRENT WATER SHORTAGE
- COMPARISON OF LAND INCOME AND EXPENDITURE
SATELLITE ACCOUNTS
- ESTIMATED SOIL MOISTURE
- STRESS VEGETATIVO SATELLITARE RILEVATO
- RELATIVE WATER DEFICIT
- DECISION-MAKING INDICATOR

CROPS
- CULTIVATION
- WEATHER DATA
- WATERING TIPS
- MAP OF THE PLOTS
HISTORICAL CHARTS
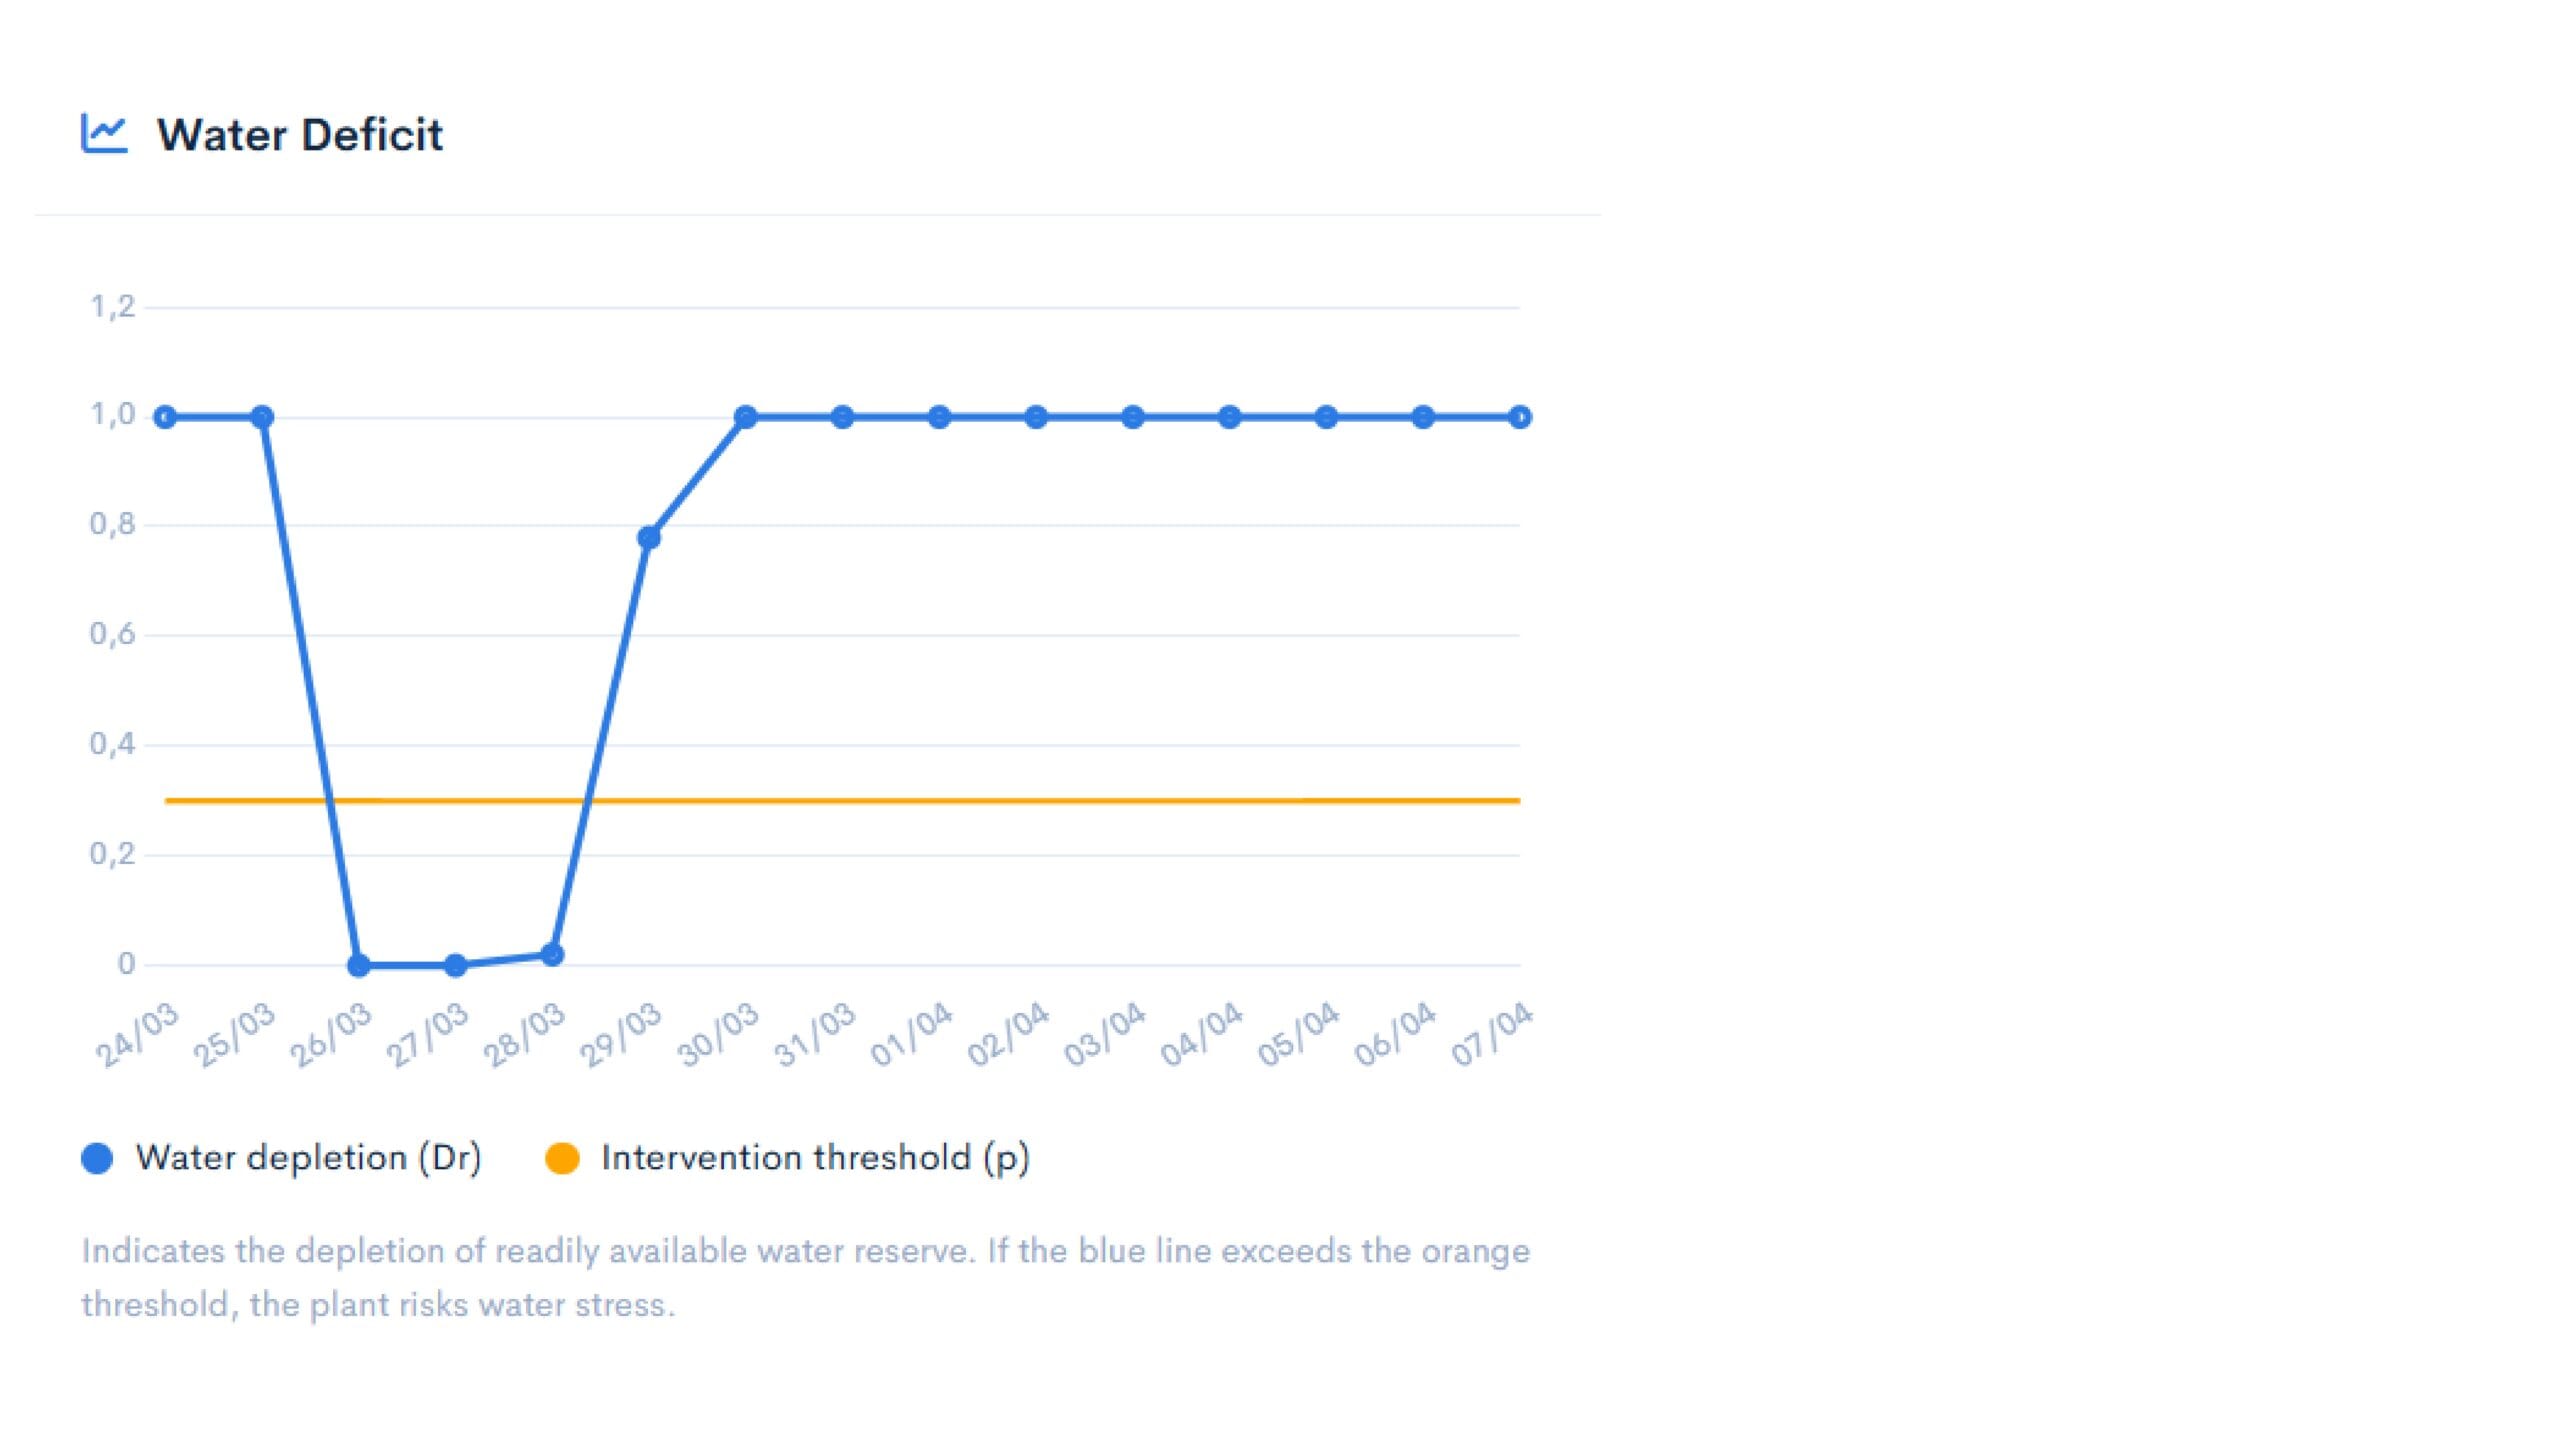
WATER DEFICIT
This indicates the level of depletion of the readily available water reserve.
If the blue line exceeds the action threshold, the crop is at risk of water stress.
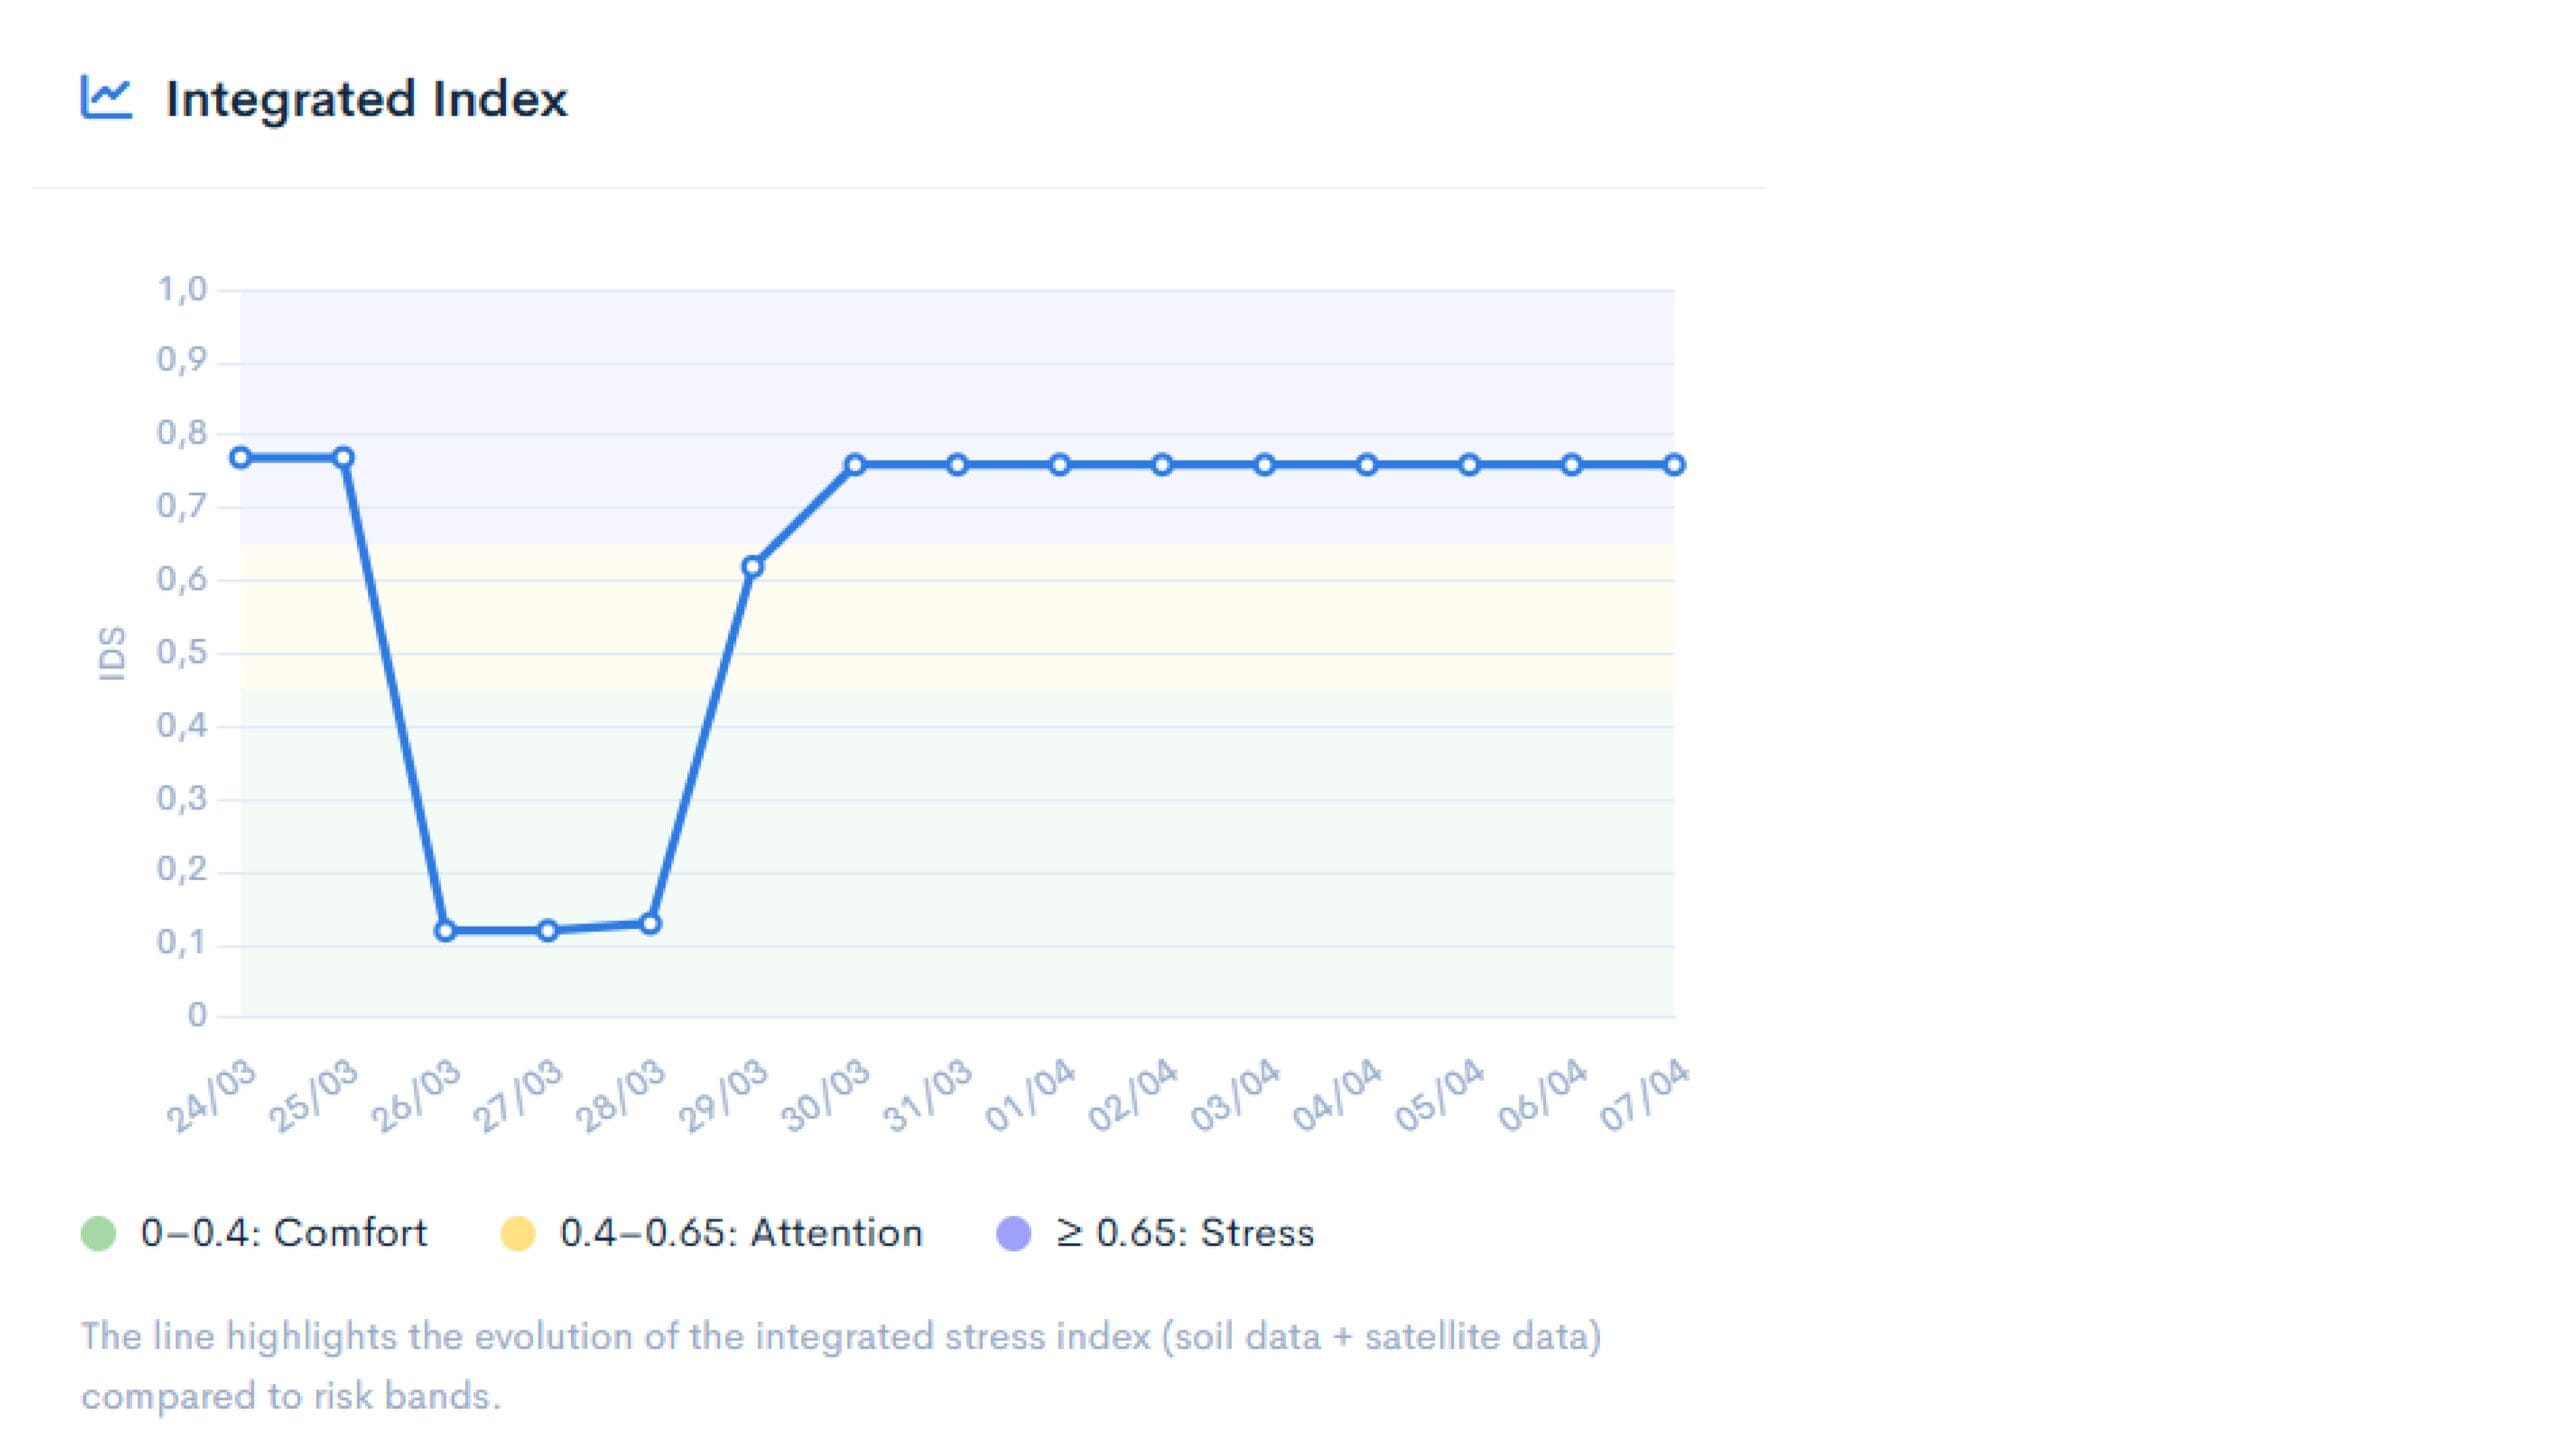
INTEGRATED INDEX
This shows the evolution of the integrated stress index (ground data + satellite data) across the various risk categories.
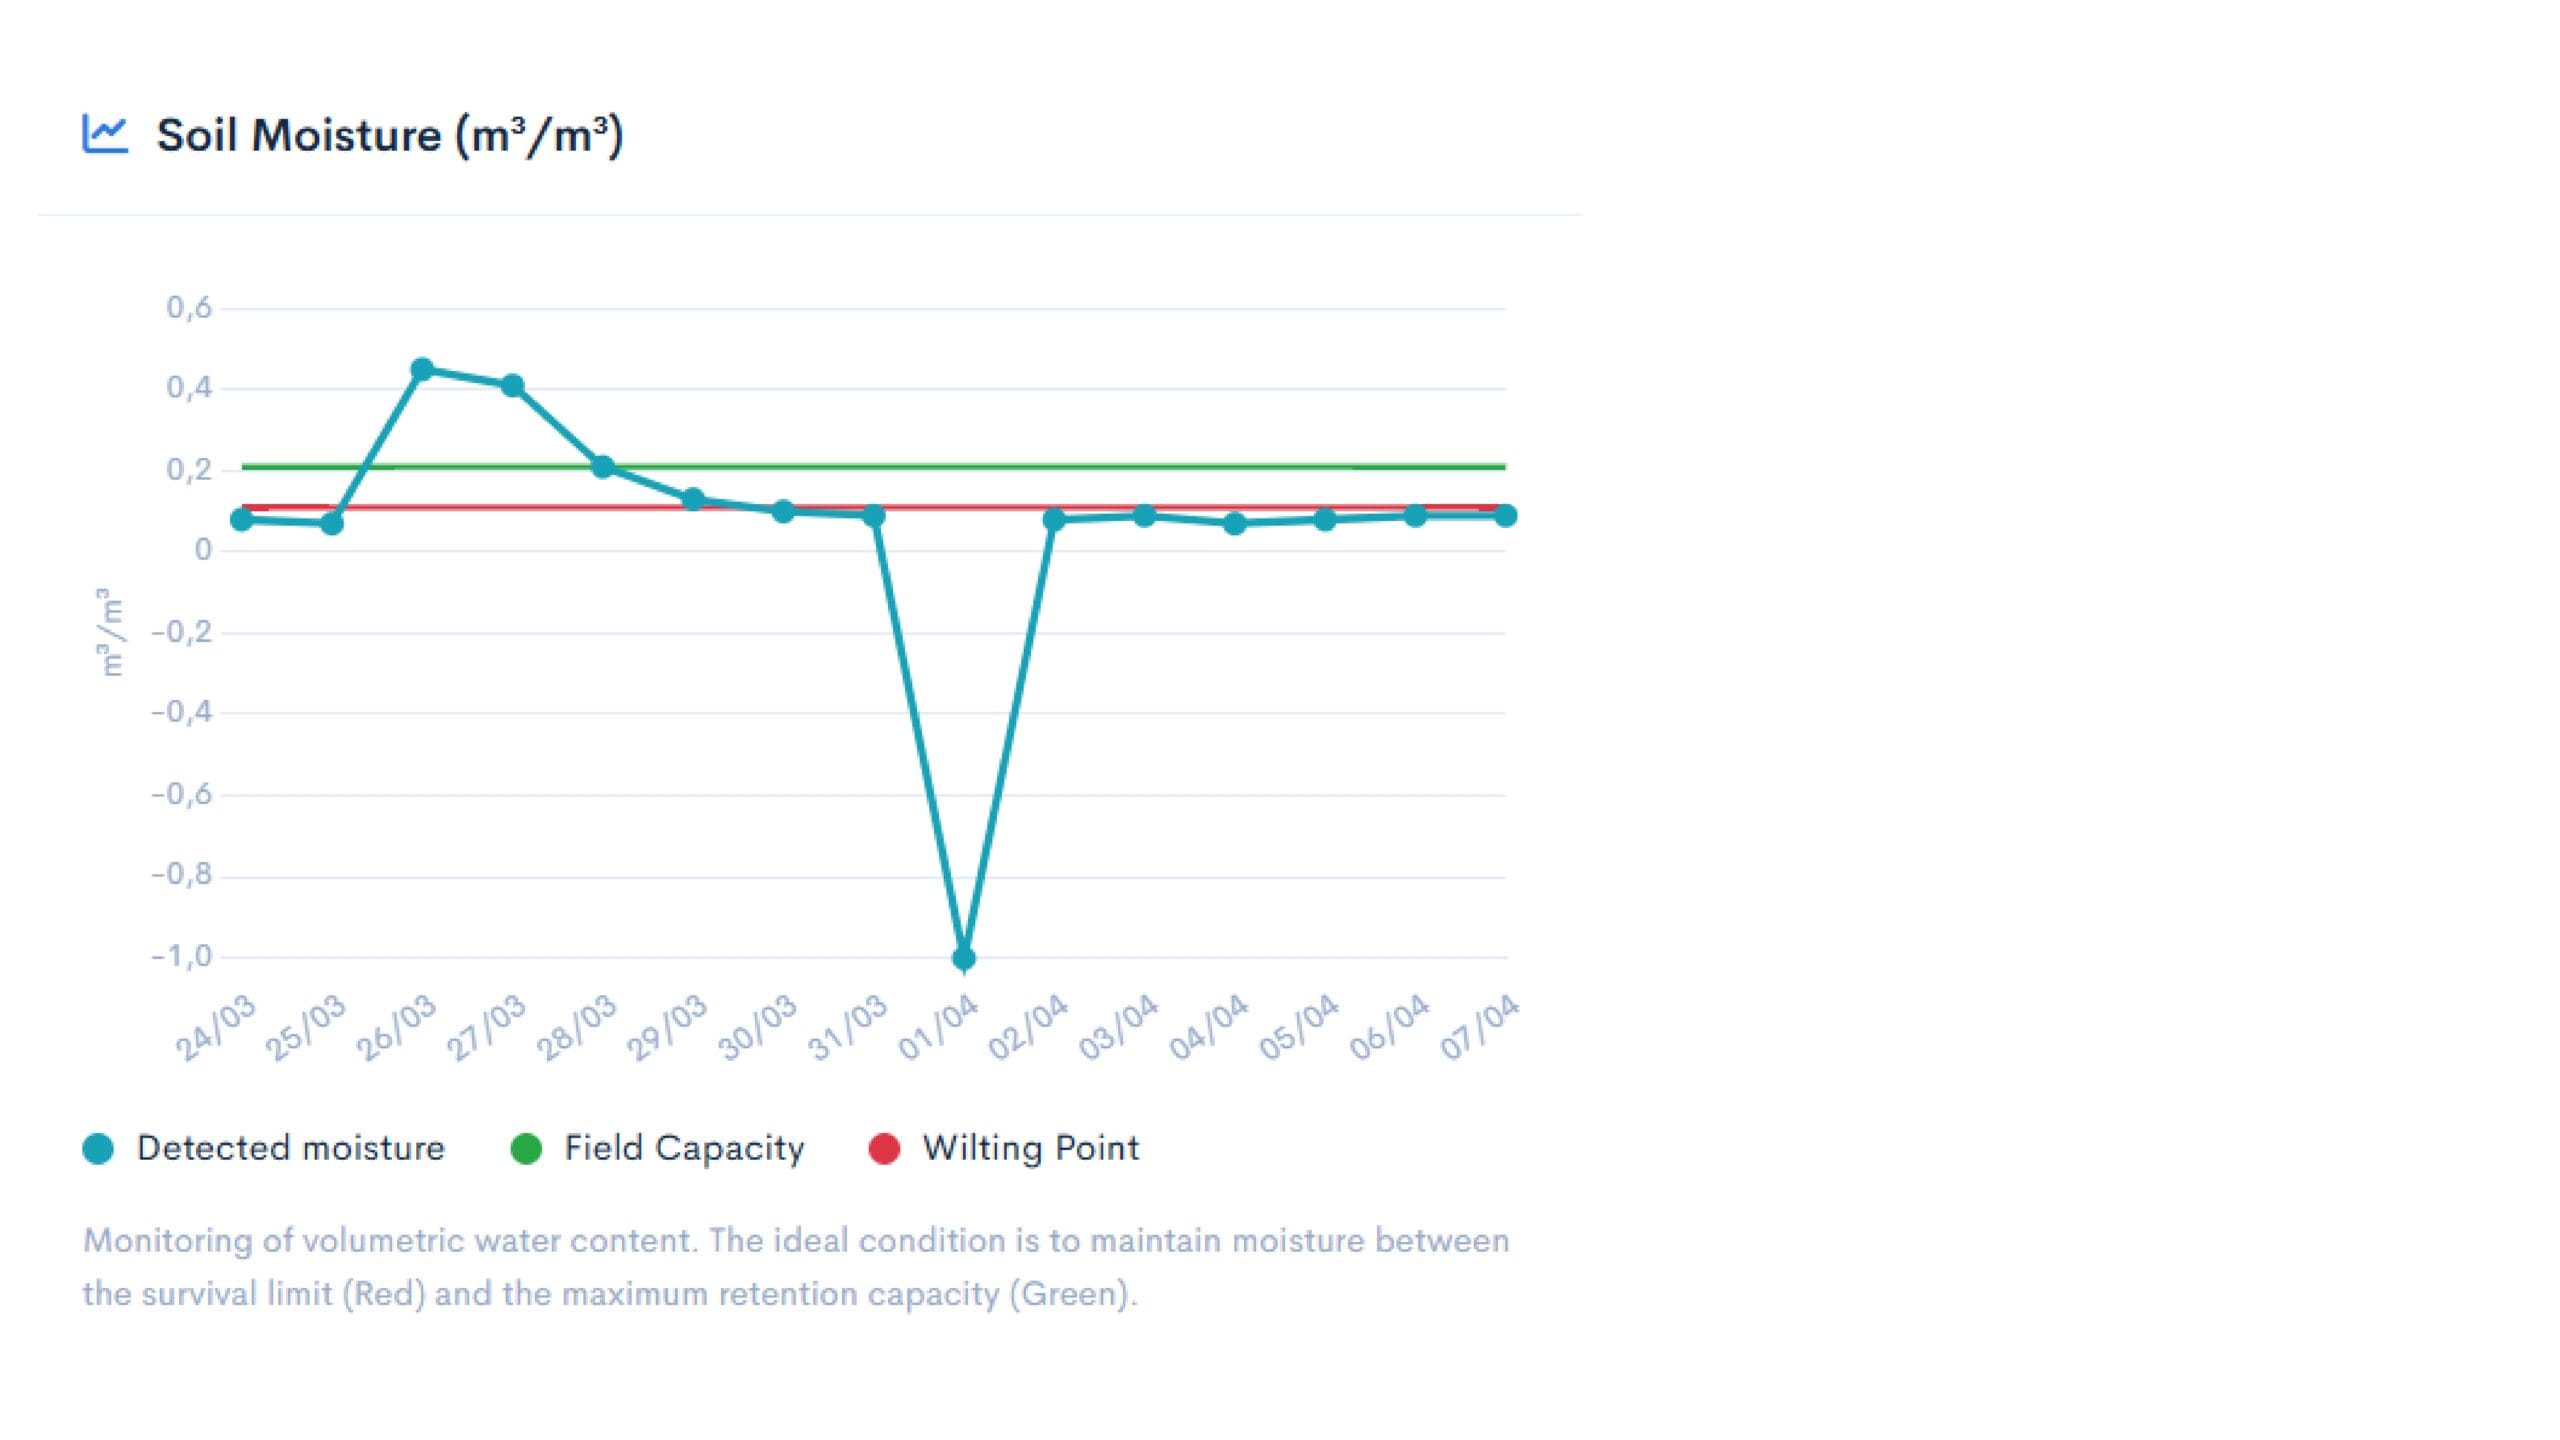
SOIL MOISTURE (m³/m³)
Monitoring the volumetric water content of the soil.
The optimal condition is to maintain moisture levels between the survival limit and the maximum water-holding capacity.
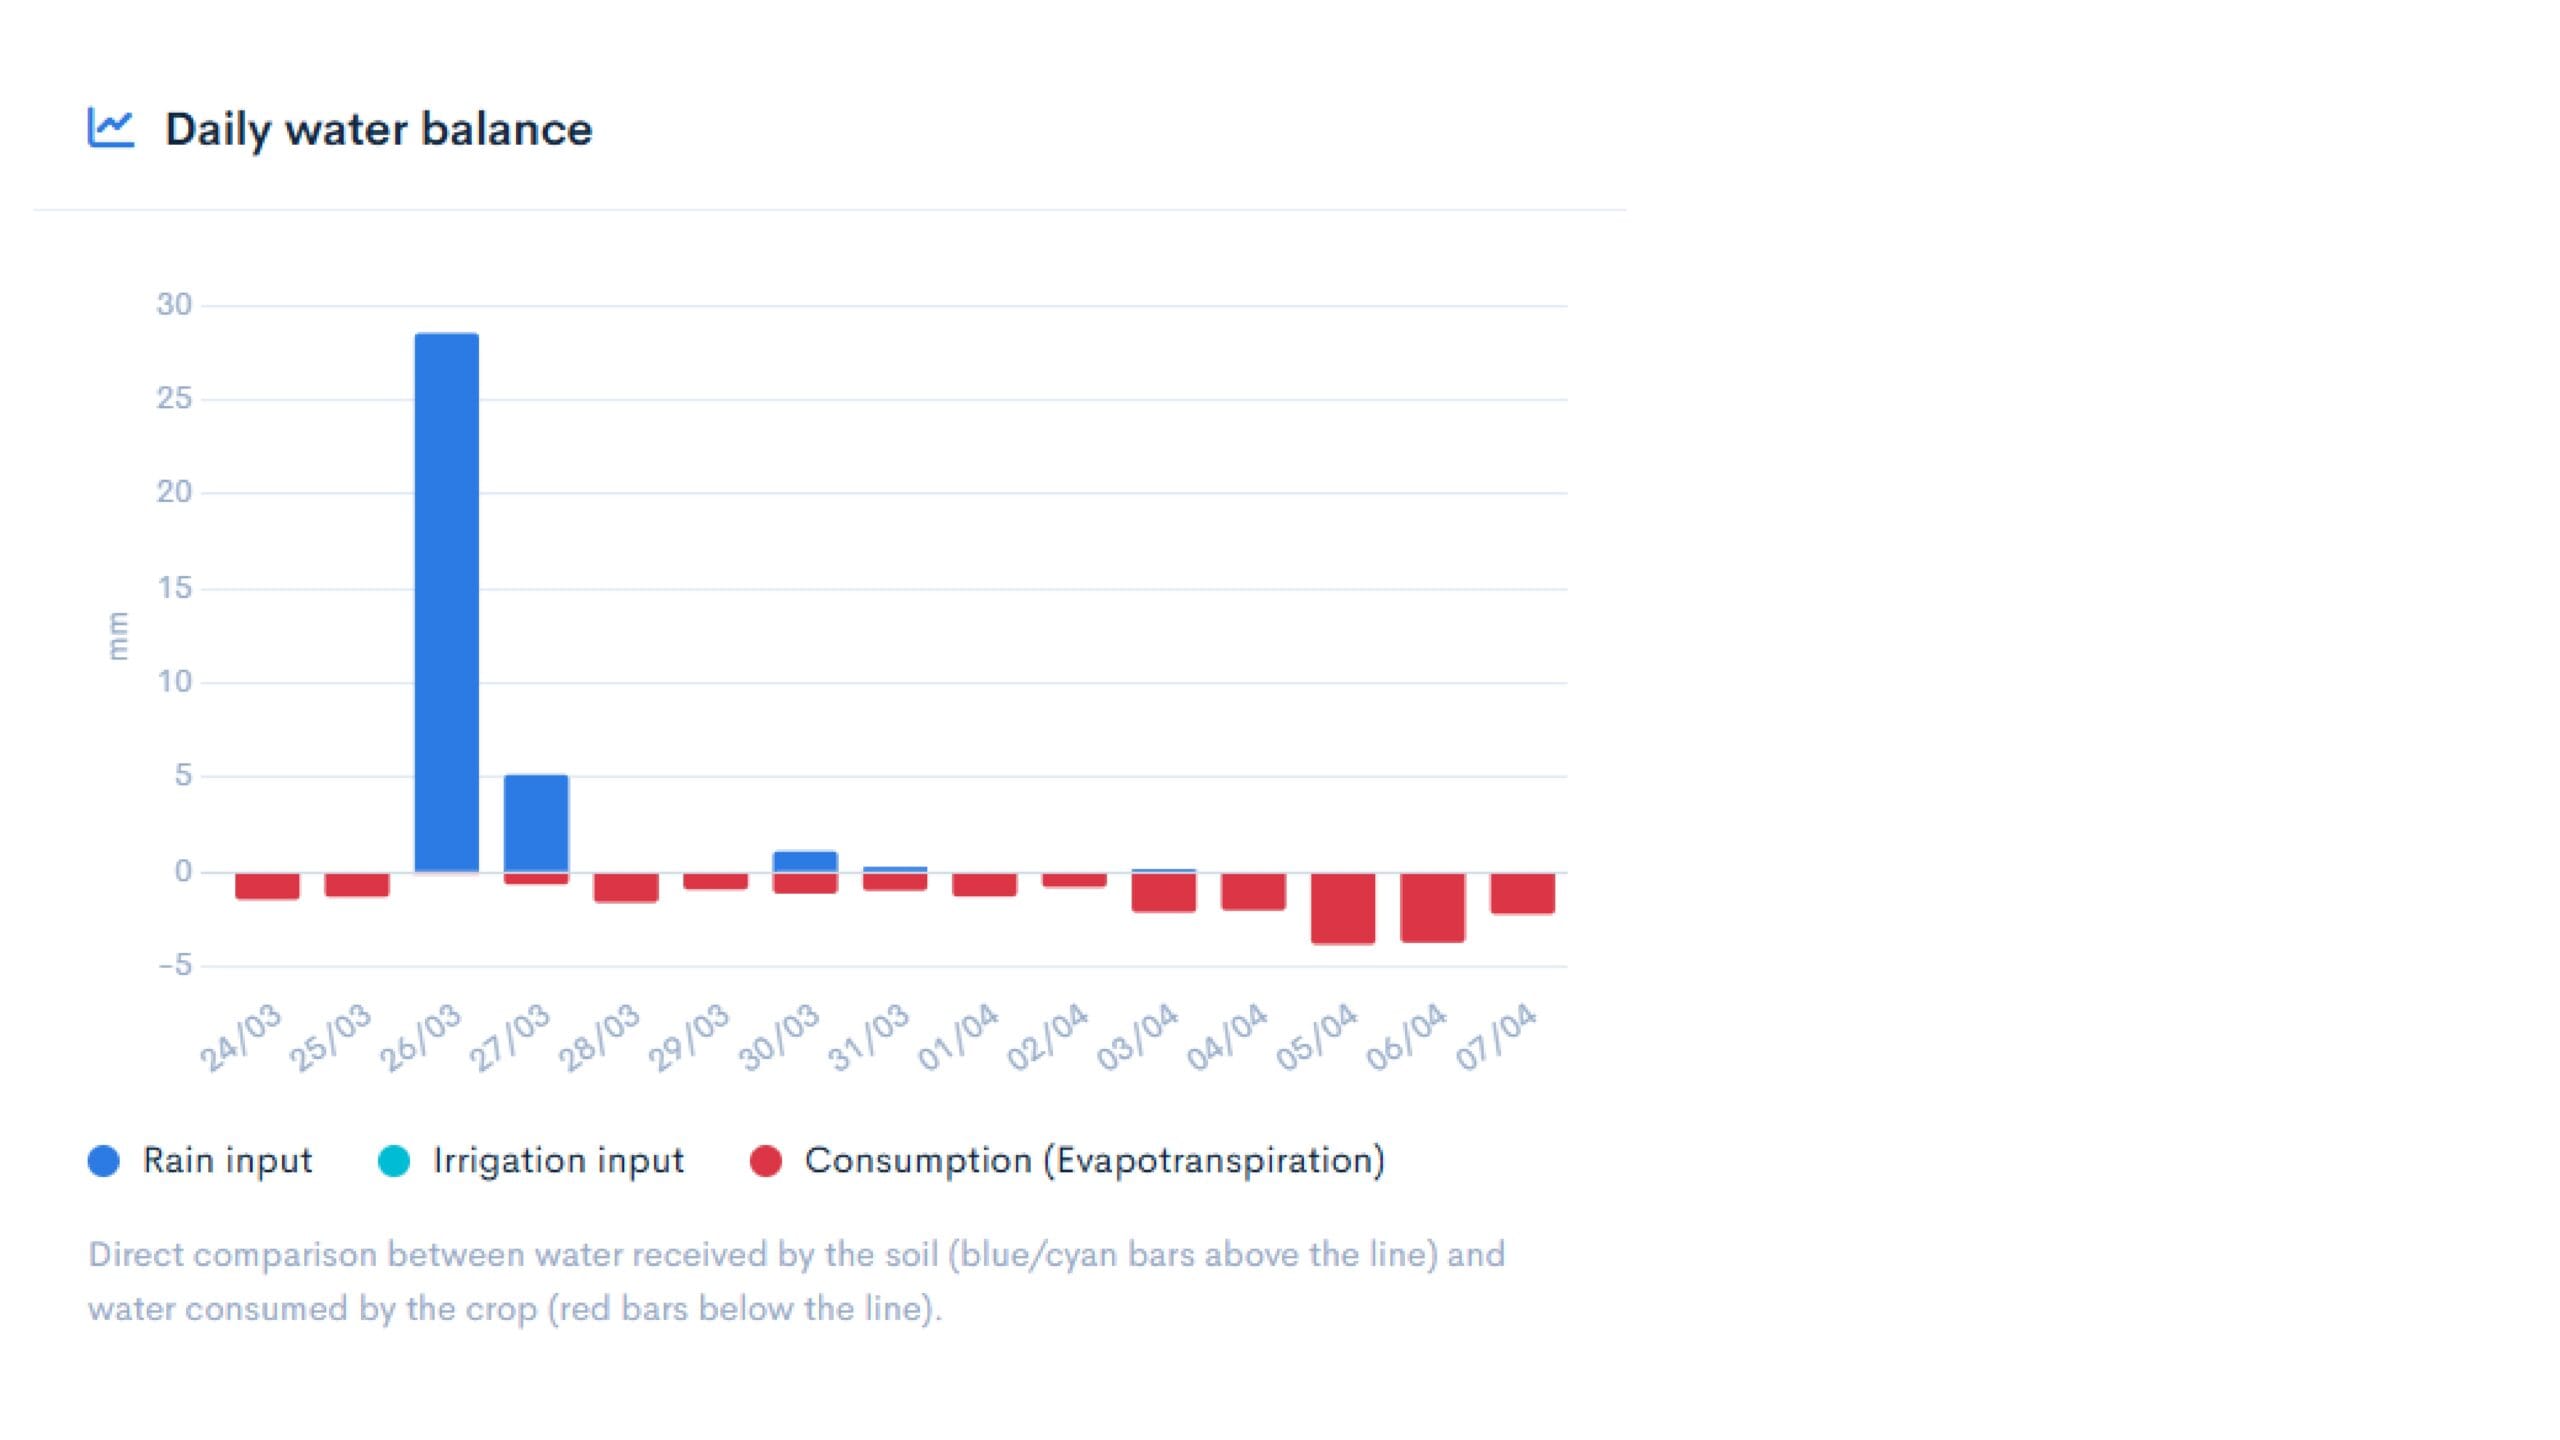
DAILY WATER BALANCE
Compares the amount of water retained in the soil with the amount consumed by the crop.
- Click above the bold headlines

IRRIGATION AND SOIL PARAMETERS
Calculation of the total volume of water required to make up the deficit, analysis of soil moisture levels, calculation of irrigation duration based on the system’s flow rate, details of the last irrigation.
Display of the crop, phenological stage, current Kc coefficient, soil type and estimated moisture content.
ANALYSIS OF SMART IRRIGATION
Soil and satellite analysis
DATI METEO LOCALIZZATI ED INDICI VEGETAZIONALI DA SATELLITE
Display of the following daily data: average temperature, relative humidity, cumulative rainfall, 3-day rainfall forecast, wind, solar radiation and evapotranspiration.
It analyses NDVI (vegetative vigour), NDWI (vegetation water content), EVI (green biomass) and DSWI (crop water stress).
The following information is displayed:
- cultivation
- a summary of the weather data
- today’s tip and those from previous days
- a map showing the plots being monitored
There is also a summary table containing the following data:
- the date and time of the update
- the irrigation board
- the type of soil, the crop and the weather conditions

The following information is displayed:
- Maximum water-holding capacity: the maximum amount of water that the soil can hold
- Comfort threshold: the level below which the crop begins to suffer
- Acqua disponibile
- Current water deficit: the amount of water required to reach field capacity
- Comparison: income and expenditure relating to the land

- Estimated soil moisture: volumetric estimate based on an agronomic model and satellite data
- Satellite stress: average vegetative stress value recorded in the plot
- Relative water deficit: percentage of depletion of the readily available water reserve
- Decision-making indicator: a composite index (0–1) that combines satellite data and the water balance

WATER DEFICIT
This indicates the level of depletion of the readily available water reserve.
If the blue line exceeds the action threshold, the crop is at risk of water stress.
INTEGRATED INDEX
This shows the evolution of the integrated stress index (ground data + satellite data) across the various risk categories.
SOIL MOISTURE (m³/m³)
Monitoring the volumetric water content of the soil.
The optimal condition is to maintain moisture levels between the survival limit and the maximum water-holding capacity.
DAILY WATER BALANCE
Confronto tra l’acqua ricevuta dal terreno e l’acqua consumata dalla coltura.
HISTORICAL CHARTS
WATER DEFICIT
This indicates the level of depletion of the readily available water reserve.
If the blue line exceeds the action threshold, the crop is at risk of water stress.
INTEGRATED INDEX
This shows the evolution of the integrated stress index (ground data + satellite data) across the various risk categories.
SOIL MOISTURE (m³/m³)
Monitoring the volumetric water content of the soil.
The optimal condition is to maintain moisture levels between the survival limit and the maximum water-holding capacity.
DAILY WATER BALANCE
Comparison between the water absorbed by the soil and the water consumed by the crop.
To gain access to Smart Irrigation, users must have a business account approved by IdroMOP and then take out an ID4 Smart Irrigation subscription.
Find out more! VISIT THE WEBSITE